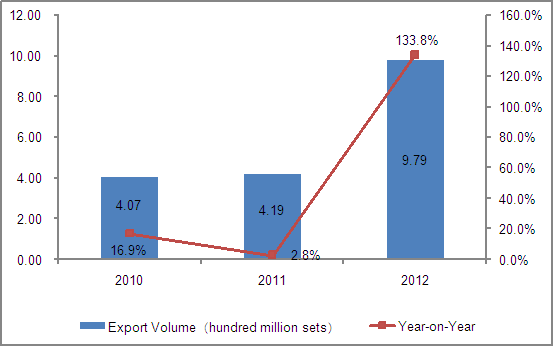
2010-2012 Chinese Christmas Tree Lamp Set (940530) Export Volume Trend
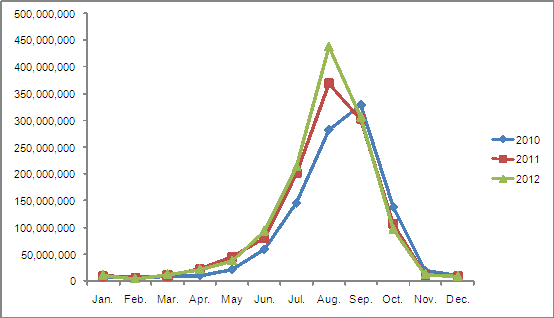
2010-2012 Chinese Christmas Tree Lamp Set (940530) Export Value Trend
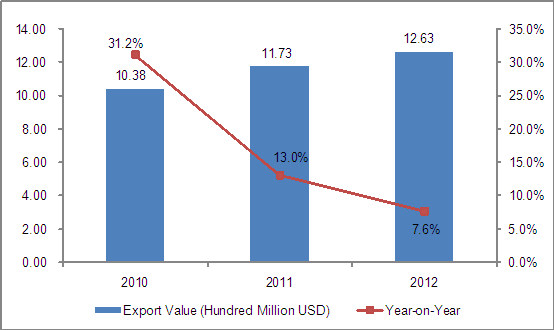
2010-2012 Chinese Christmas Tree Lamp Set (940530) Monthly Trend of Export Volume Unit (10000 Sets)
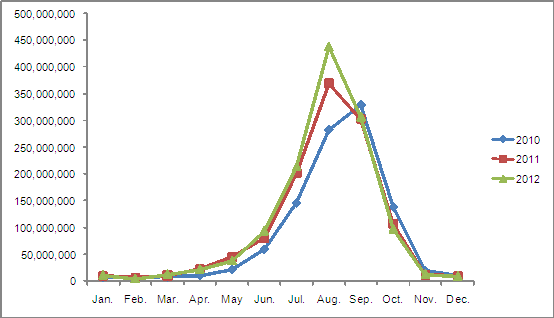
2010-2012 Chinese Christmas Tree Lamp Set (940530) Monthly Trend of Export Value (USD)
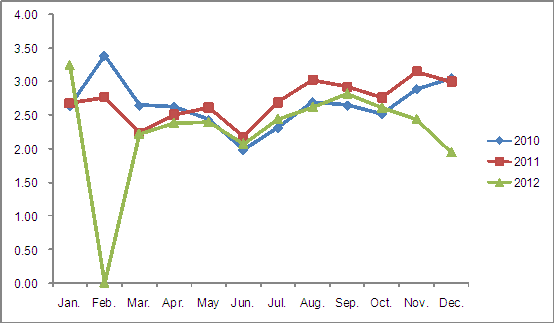
2010-2012 Chinese Christmas Tree Lamp Set (940530) Monthly Average Export Unit Price (USD/Set)
From 2010 to 2012, the total exports of Chinese Christmas tree lamp sets are on the rise, especially in 2012, the total exports reached to 980 million units with a year-on-year increase of 133.8%. The total value of Chinese Christmas tree lamp sets increased year by year from 2010 to 2012. In 2012 the export value amounted to about 1.26 billion US dollars, with a year-on-year increase of 7.6%.
From the monthly trend of export volume and export value of Chinese Christmas tree lamp sets from 2010 to 2012, we can see that from June to October is the shopping season of such products.
Monthly average export unit price of Chinese Christmas tree lamp sets from 2010 to 2012 shows that the export unit price fluctuation is slight except for February 2012. In February 2012, the export volume of Chinese Christmas tree lamp sets rose sharply, while unit price dropped significantly.
2010-2012 Chinese Christmas Tree Lamp Set (940530) Export Markets Analysis
|
No. | Countries/Regions | Export Value (USD) | Exports Growth 2012 Compared with 2010 | ||
| 2010 | 2011 | 2012 | |||
| 1 | USA | 427,114,398 | 457,991,597 | 496,658,974 | 16.3% |
| 2 | Germany | 67,572,770 | 77,502,394 | 82,410,709 | 22.0% |
| 3 | UK | 62,631,014 | 65,981,136 | 75,725,686 | 20.9% |
| 4 | Netherland | 73,010,653 | 76,196,768 | 73,673,635 | 0.9% |
| 5 | Brazil | 22,441,499 | 36,151,037 | 70,459,573 | 214.0% |
| 6 | Canada | 35,015,940 | 47,907,719 | 50,270,804 | 43.6% |
| 7 | Mexico | 52,618,642 | 53,742,826 | 48,255,360 | -8.3% |
| 8 | Italy | 39,822,934 | 46,811,006 | 35,800,519 | -10.1% |
| 9 | Australia | 17,743,503 | 20,885,272 | 33,790,877 | 90.4% |
| 10 | France | 19,195,093 | 23,715,741 | 24,608,031 | 28.2% |
| 11 | Sweden | 19,992,008 | 18,471,005 | 24,060,876 | 20.4% |
| 12 | Belgium | 22,728,900 | 22,773,981 | 20,262,566 | -10.9% |
| 13 | India | 5,797,338 | 12,499,633 | 17,286,835 | 198.2% |
| 14 | Columbia | 7,729,468 | 12,198,280 | 16,923,884 | 119.0% |
| 15 | Panama | 11,942,686 | 13,560,745 | 14,139,879 | 18.4% |
| 16 | Russian Federation | 11,427,964 | 15,692,554 | 12,624,828 | 10.5% |
| 17 | Japan | 9,208,073 | 10,570,056 | 11,759,059 | 27.7% |
| 18 | Venezuela | 3,028,382 | 5,138,553 | 11,562,200 | 281.8% |
| 19 | Chile | 5,283,085 | 8,636,730 | 10,658,014 | 101.7% |
| 20 | Poland | 8,458,147 | 8,787,944 | 9,575,292 | 13.2% |
2010-2012 Chinese Christmas Tree Lamp Set (940530) Export Markets Share Analysis
| No. | Countries/Regions | Proportion of Export Value | ||
| 2010 | 2011 | 2012 | ||
| 1 | USA | 41.1% | 39% | 39.3% |
| 2 | Germany | 6.5% | 6.6% | 6.5% |
| 3 | UK | 6% | 5.6% | 6% |
| 4 | Netherland↓ | 7% | 6.5% | 5.8% |
| 5 | Brazil↑ | 2.2% | 3.1% | 5.6% |
| 6 | Canada | 3.4% | 4.1% | 4% |
| 7 | Mexico↓ | 5.1% | 4.6% | 3.8% |
| 8 | Italy | 3.8% | 4% | 2.8% |
| 9 | Australia↑ | 1.7% | 1.8% | 2.7% |
| 10 | France | 1.8% | 2% | 1.9% |
| 11 | Sweden | 1.9% | 1.6% | 1.9% |
| 12 | Belgium↓ | 2.2% | 1.9% | 1.6% |
| 13 | India↑ | 0.6% | 1.1% | 1.4% |
| 14 | Columbia | 0.7% | 1.0% | 1.3% |
| 15 | Panama | 1.2% | 1.2% | 1.1% |
| 16 | Russian Federation | 1.1% | 1.3% | 1.0% |
| 17 | Japan | 0.9% | 0.9% | 0.9% |
| 18 | Venezuela↑ | 0.3% | 0.4% | 0.9% |
| 19 | Chile↑ | 0.5% | 0.7% | 0.8% |
| 20 | Poland | 0.8% | 0.7% | 0.8% |
Note:↑represents that import value in proportion of Chinese total exports in 2010-2012 continue to increase,↓represents that import value in proportion of Chinese total exports in 2010-2012 continue to decrease.
(Source: China Customs)


