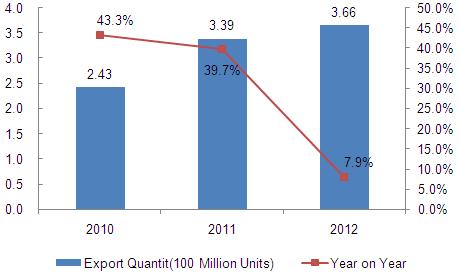
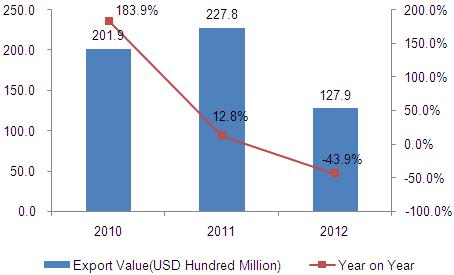
The export volume of China Solar Battery increased 7.9% over the same period before and reached 366 million units between 2010 to2012, and the export value reached $ 12.79 billion at 2012, which dropped 43.9% compared with 2011.
The Netherlands is the biggest China solar battery consumption market at 2012, and the proportion is 29.95%, the next two bigger import countries for Chinese solar batteries are Germany and USA, and the proportion are 12.39% and 10.97%.
The Major Original Place of Delivered China solar battery distributes in Jiangsu, Zhejiang and Shanghai at 2012. And the corresponding proportion is 59.88%, 12.11% and 9.51%.
The Annual Export Value Trend of Chinese Solar Battery (HS:85414020) between 2010-2012
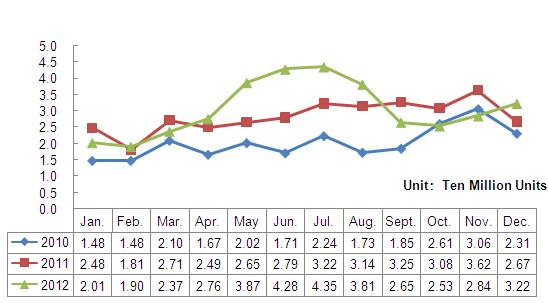
The Monthly Export Volume Trend of Chinese Solar Battery (HS:85414020) between 2010-2012
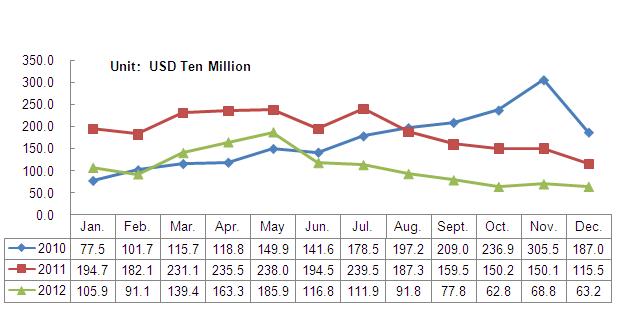
The Monthly Export Value Trend of Chinese Solar Battery (HS:85414020) between 2010-2012
The Export Unit Cost Trend of Chinese Solar Battery (HS:85414020) between 2010-2012
The export volume of China Solar Battery increased 7.9% over the same period before and reached 366,000,000 units between 2010 to2012, and the export value reached $ 12.79 billion at 2012, which dropped 43.9% compared with 2011.
The monthly export volume trend shows that the high export season focuses on May-August of 2012. And the monthly export value trend shows that 2011 is better than 2012, also 2012 export unit cost is lower than 2011.
Major Country/Region of China Solar Battery (HS:85414020)Export between 2010-2012 (Ranked by 2012 Export Value).
| No. | Export Country/Region | Value(USD) | Value increased 2012 over 2010 | ||
| 2010 | 2011 | 2012 | |||
| 1 | Netherlands | 3,438,071,998 | 5,021,618,551 | 3,829,338,881 | 11.4% |
| 2 | Germany | 6,451,300,896 | 4,814,931,745 | 1,584,391,899 | -75.4% |
| 3 | USA | 1,042,529,620 | 2,494,706,438 | 1,402,203,554 | 34.5% |
| 4 | Belgium | 772,503,060 | 1,614,040,182 | 995,419,323 | 28.9% |
| 5 | Japan | 319,288,434 | 372,709,874 | 893,071,735 | 179.7% |
| 6 | Australia | 713,368,329 | 1,004,903,128 | 741,562,775 | 4.0% |
| 7 | Italy | 4,383,955,702 | 3,573,525,656 | 723,013,208 | -83.5% |
| 8 | Ukraine | 38,005,860 | 199,983,667 | 328,617,494 | 764.6% |
| 9 | Greece | 88,466,729 | 310,922,532 | 267,645,039 | 202.5% |
| 10 | Thailand | 10,538,690 | 229,116,990 | 210,255,949 | 1895.1% |
| 11 | UK | 52,647,023 | 300,740,331 | 209,033,493 | 297.0% |
| 12 | India | 80,069,111 | 491,494,565 | 193,777,502 | 142.0% |
| 13 | Spain | 495,624,553 | 334,636,956 | 164,682,670 | -66.8% |
| 14 | HK | 333,098,504 | 301,765,105 | 146,248,439 | -56.1% |
| 15 | France | 539,424,156 | 491,839,598 | 145,627,421 | -73.0% |
| 16 | Denmark | 3,325,716 | 14,218,190 | 126,306,938 | 3697.9% |
| 17 | Korea | 104,110,657 | 57,955,659 | 109,255,218 | 4.9% |
| 18 | Canada | 149,476,864 | 269,855,470 | 90,711,222 | -39.3% |
| 19 | Bulgaria | 5,823,377 | 111,090,819 | 85,748,346 | 1372.5% |
| 20 | Czech | 567,808,523 | 96,417,442 | 57,099,695 | -89.9% |
The Trend of Major Country/Region of China Solar Battery(HS:85414020)Export Marking Share between 2010-2012
| No | Export Country/Region | Export Value Proportion | ||
| 2010 | 2011 | 2012 | ||
| 1 | Netherlands↑ | 17.03% | 22.05% | 29.95% |
| 2 | Germany↓ | 31.95% | 21.14% | 12.39% |
| 3 | USA↑ | 5.16% | 10.95% | 10.97% |
| 4 | Belgium↑ | 3.83% | 7.09% | 7.78% |
| 5 | Japan↑ | 1.58% | 1.64% | 6.98% |
| 6 | Australia↑ | 3.53% | 4.41% | 5.80% |
| 7 | Italy↓ | 21.71% | 15.69% | 5.65% |
| 8 | Ukraine↑ | 0.19% | 0.88% | 2.57% |
| 9 | Greece↑ | 0.44% | 1.36% | 2.09% |
| 10 | Thailand↑ | 0.05% | 1.01% | 1.64% |
| 11 | UK↑ | 0.26% | 1.32% | 1.63% |
| 12 | India | 0.40% | 2.16% | 1.52% |
| 13 | Spain↓ | 2.45% | 1.47% | 1.29% |
| 14 | HK↓ | 1.65% | 1.32% | 1.14% |
| 15 | France↓ | 2.67% | 2.16% | 1.14% |
| 16 | Denmark↑ | 0.02% | 0.06% | 0.99% |
| 17 | Korea | 0.52% | 0.25% | 0.85% |
| 18 | Canada | 0.74% | 1.18% | 0.71% |
| 19 | Bulgaria↑ | 0.03% | 0.49% | 0.67% |
| 20 | Czech | 2.81% | 0.42% | 0.45% |
Note: “↑” means the index keep updating in 2010-2012, “↓” means index keep dropping in 2010-2012.
The statistics by 2012 China's solar battery exports shows that 2012 top twenty export markets of China solar battery are Netherlands, Germany, USA, Belgium, Japan, Australia, Italy, Ukraine, Greece, Thailand, UK, India, Spain, HK, France, Denmark, Korea, Canada, Bulgaria and Czech.
Between 2010 and 2012, China solar battery export value keeps big increased to Japan, Ukraine, Greece, Thailand, UK, India, Denmark and Bulgaria. And the corresponding increased rates are 179.7%,764.6%,202.5%,1895.1%,297.0%,142.0%,3697.9% and 1372.5%. During 3 years, the countries kept increasing marketing share of export value are Netherlands, USA, Belgium, Japan, Australia, Ukraine, Greece, Thailand, UK, Denmark and Bulgaria.


