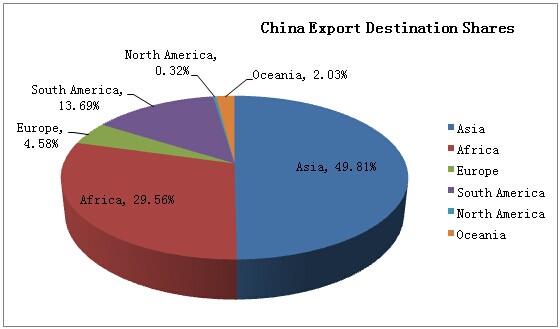
In 2014, China commercial vehicles export amount increased in international market. According to statistics, commercial vehicle export amount reached US $8100000000, up by 6.6% over the same period last year; while commercial vehicle export volume reached 386,886 units, up by 7.35% year-on-year. Subdivided into various continents in the world, Asia achieved $4054000000, taking 49.81% shares of total exports. In Africa, Europe and Latin America's exports were $2406000000, $370000000 and $1114000000.

2014 export destination rank
NO.1
Destination: Vietnam
2014 export amount: $696,000,000
Proportion: 8.56%
2014 export volume: 31,616 units
Growth year-on-year: 99.91%
NO.2
Destination: Algeria
2014 export amount: $664,000,000
Proportion: 8.16%
2014 export volume: 56,479 units
Growth year-on-year: -19.43%
NO.3
Destination: Iran
2014 export amount: $376,000,000
Proportion: 4.62%
2014 export volume: 11,947 units
Growth year-on-year: 167.39%
NO.4
Destination: Saudi Arabia
2014 export amount: $370,000,000
Proportion: 4.55%
2014 export volume: 10,612 units
Growth year-on-year: 26.83%
NO.5
Destination: Venezuela
2014 export amount: $321,000,000
Proportion: 3.95%
2014 export volume: 7,206 units
Growth year-on-year: -32.94%
NO.6
Destination: Angola
2014 export amount: $286,000,000
Proportion: 3.52%
2014 export volume: 11,760 units
Growth year-on-year: 94.57%
NO.7
Destination: Burma
2014 export amount: $258,000,000
Proportion: 3.17%
2014 export volume: 19,366 units
Growth year-on-year: 29.47%
NO.8
Destination: the Philippines
2014 export amount: $242,000,000
Proportion: 2.98%
2014 export volume: 8,277 units
Growth year-on-year: 31.57%
NO.9
Destination: Russia
2014 export amount: $231,000,000
Proportion: 2.84%
2014 export volume: 3,920 units
Growth year-on-year: -28.51%
NO.10
Destination: Nigeria
2014 export amount: $221,000,000
Proportion: 2.71%
2014 export volume: 7,796 units
Growth year-on-year: -18.73%


