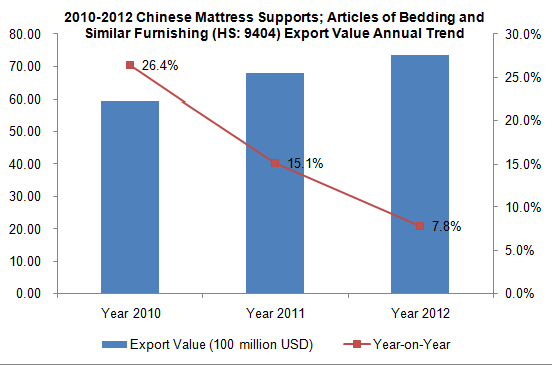
2010-2012 Chinese Mattress Supports Industry Export Trend Analysis
Note:
HS Code: 9404, Mattress supports; articles of bedding and similar furnishing (for example, mattresses, quilts, eiderdowns, cushions, pouffes and pillows) fitted with springs or stuffed or internally fitted with any material or of cellular rubber or plastics, whether or not covered, hereinafter referred to as ”Mattress supports; articles of bedding and similar furnishing”
2010-2012 Chinese Mattress Supports; Articles of Bedding and Similar Furnishing (HS: 9404) Export Trend

2010-2012 Chinese Mattress Supports; Articles of Bedding and Similar Furnishing total exports increased year by year, of which, in 2012 exports totaled approximately $ 7.372 billion, with an increase of 7.8%.
2010-2012 Chinese Mattress Supports; Articles of Bedding and Similar Furnishing (HS: 9404) Export Market Analysis
| NO. | Export Country/Region | Export Value (USD) | Export Value Increase 2012 Compared with 2010 | ||
|
|
| 2010 | 2011 | 2012 |
|
| 1 | USA | 2,048,373,658 | 2,139,042,362 | 2,310,536,463 | 12.80% |
| 2 | Japan | 883,874,478 | 1,148,188,537 | 1,217,112,970 | 37.70% |
| 3 | Australia | 199,190,809 | 258,318,314 | 301,982,387 | 51.60% |
| 4 | Germany | 222,596,903 | 263,291,770 | 257,343,308 | 15.61% |
| 5 | UK | 251,237,038 | 256,966,051 | 248,770,937 | -0.98% |
| 6 | Canada | 172,880,360 | 185,518,697 | 211,628,716 | 22.41% |
| 7 | South Korea | 144,920,669 | 164,922,848 | 163,636,813 | 12.91% |
| 8 | Netherlands | 118,090,392 | 138,462,435 | 141,453,963 | 19.78% |
| 9 | UAE | 124,261,892 | 132,379,018 | 132,010,666 | 6.24% |
| 10 | Hong kong | 92,290,459 | 105,343,694 | 128,622,197 | 39.37% |
| 11 | France | 139,545,715 | 134,814,269 | 127,795,392 | -8.42% |
| 12 | Saudi Arabia | 60,205,570 | 92,124,607 | 122,003,198 | 102.64% |
| 13 | South Africa | 106,501,352 | 97,313,103 | 102,550,765 | -3.71% |
| 14 | Spain | 107,511,061 | 108,493,362 | 92,919,567 | -13.57% |
| 15 | Malaysia | 43,792,056 | 72,146,096 | 87,150,340 | 99.01% |
| 16 | Chile | 52,481,594 | 67,403,573 | 77,304,887 | 47.30% |
| 17 | Brazil | 26,207,240 | 51,966,024 | 76,966,747 | 193.69% |
| 18 | Taiwan | 67,551,991 | 80,650,215 | 74,759,276 | 10.67% |
| 19 | Poland | 44,046,283 | 58,346,353 | 70,059,022 | 59.06% |
| 20 | Mexico | 48,556,123 | 80,042,850 | 68,776,734 | 41.64% |
2010-2012 Chinese Mattress Supports; Articles of Bedding and Similar Furnishing (HS: 9404) Export Market Share Analysis
| NO. | Export Country/Region | Export Value in Proportion | ||
|
|
| 2010 | 2011 | 2012 |
| 1 | USA | 34.49% | 31.29% | 31.34% |
| 2 | Japan | 14.88% | 16.79% | 16.51% |
| 3 | Australia↑ | 3.35% | 3.78% | 4.10% |
| 4 | Germany | 3.75% | 3.85% | 3.49% |
| 5 | UK↓ | 4.23% | 3.76% | 3.37% |
| 6 | Canada | 2.91% | 2.71% | 2.87% |
| 7 | South Korea↓ | 2.44% | 2.41% | 2.22% |
| 8 | Netherlands | 1.99% | 2.03% | 1.92% |
| 9 | UAE↓ | 2.09% | 1.94% | 1.79% |
| 10 | Hong Kong | 1.55% | 1.54% | 1.74% |
| 11 | France↓ | 2.35% | 1.97% | 1.73% |
| 12 | Saudi Arabia↑ | 1.01% | 1.35% | 1.65% |
| 13 | South Africa↓ | 1.79% | 1.42% | 1.39% |
| 14 | Spain↓ | 1.81% | 1.59% | 1.26% |
| 15 | Malaysia↑ | 0.74% | 1.06% | 1.18% |
| 16 | Chile↑ | 0.88% | 0.99% | 1.05% |
| 17 | Brazil↑ | 0.44% | 0.76% | 1.04% |
| 18 | Taiwan | 1.14% | 1.18% | 1.01% |
| 19 | Poland↑ | 0.74% | 0.85% | 0.95% |
| 20 | Mexico | 0.82% | 1.17% | 0.93% |
Note:↑represents import value accounted for the proportion of China's total exports continued to increase from 2010 to 2012, ↓represents import value accounted for the proportion of China's total exports continued to decrease from 2010 to 2012
(Source: China Customs)


