| HS Code | Product Name |
| 3917 | Tubes, pipes and hoses, and fittings therefor (for examples, joints, elbows flanges) of plastics |
| 7303 | Tubes, pipes and hollow profiles of cast iron |
| 7304 | Tubes, Pipes And Hollow Profiles, Seamless, Of Iron (Other Than Cast Iron) Or Steel. |
| 7305 | Other tubes and pipes (for example, welded, riveted or similarly closed), having circular cross-sections, the external diameter of which exceeds 406,4 mm, of iron or steel |
| 7306 | Other tubes, pipes and hollow profiles (for example, open seam or welded, riveted or similarly closed), of iron or steel |
| 7307 | Tube or pipe fittings (for example, couplings, elbows, sleeves), of iron or steel |
| 7411 | Copper pipe & tube |
| 7608 | Aluminum pipe & tube |
The Export Analysis of China Tubes, pipes and hoses, and fittings of plastics (HS: 3917)between Jan - May 2013
The export amount and value of China Tubes, pipes and hoses, and fittings of plastics between Jan - May 2013
| Month | Amount(Kg) | Value(USD) | Compared with the same period of last year | |
|
|
|
| Amount | Value |
| January | 50,176,807 | 191,247,117 | 18.3% | 28.4% |
| February | 30,648,495 | 129,016,262 | 22.5% | 48.4% |
| March | 38,611,453 | 156,799,865 | -10.1% | 1.2% |
| April | 49,155,525 | 193,839,882 | 16.3% | 21.2% |
| May | 51,017,438 | 206,612,471 | 6.9% | 17.7% |
| Total | 219,609,718 | 877,515,597 | 9.6% | 20.8% |
In first five months of 2013, China export amount of China Tubes, pipes and hoses, and fittings of plastics reached 219.6 thousand tons, increased 9.6% as before; export value reached $ 878 million, increased 20.8% as before.
The Major Import Countries/Regions of China Tubes, Pipes and Hoses, and Fittings of Plastics between Jan - May 2013
| No. | Country | Amount(Kg) | Value(USD) | Compared with the same period of last year | |
|
|
|
|
| amount | value |
| 1 | Unite States | 32,930,485 | 196,035,517 | 29.2% | 35.7% |
| 2 | Japan | 4,248,349 | 35,164,375 | / | -2.2% |
| 3 | Russia | 10,013,113 | 34,559,383 | 22.4% | 18.9% |
| 4 | Netherland | 3,096,631 | 30,699,941 | 238% | 525.5% |
| 5 | HK | 11,946,760 | 30,489,840 | -16.2% | -18% |
| 6 | Angola | 11,164,219 | 27,758,821 | 20.7% | 51.8% |
| 7 | Australia | 5,309,656 | 23,999,103 | 43.6% | 52.5% |
| 8 | Kazakhstan | 4,655,842 | 23,636,462 | 8.6% | 22.6% |
| 9 | Vietnam | 4,354,634 | 21,256,548 | 46% | 78.6% |
| 10 | Indonesia | 6,394,656 | 18,530,020 | 30.8% | 61.9% |
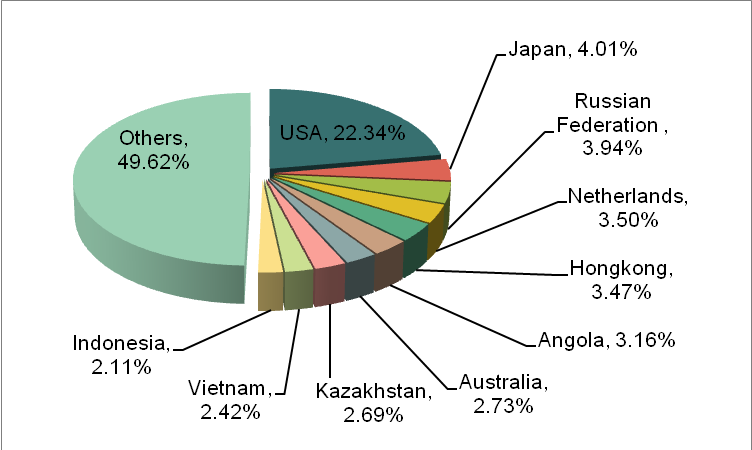
At the top ten exports countries/regions, the largest increasing export amount country is Netherland, which takes a 238% growth; the largest increasing export amount country is also Netherland, which takes a 525.5% growth.
Original Goods Delivered Place of China Tubes, Pipes and Hoses, and Fittings of Plastics
| No. | Regions | amount(Kg) | value(USD) | Compared with the same period of last year | |
|
|
|
|
| amount | value |
| 1 | Zhejiang | 83,345,421 | 308,399,739 | 6.8% | 8.6% |
| 2 | Guangdong | 50,732,643 | 207,020,486 | -1.1% | 49.8% |
| 3 | Jiangsu | 14,926,611 | 81,711,405 | 9.6% | -1.1% |
| 4 | Shanghai | 13,154,749 | 61,743,269 | 22.4% | 14.9% |
| 5 | Shandong | 16,648,073 | 46,517,718 | 50.3% | 43.2% |
| 6 | Fujian | 7,783,100 | 31,185,162 | 4.4% | 40.4% |
| 7 | Beijing | 3,354,734 | 24,175,880 | -28.5% | -3.4% |
| 8 | Heilongjiang | 2,673,851 | 16,204,651 | -0.7% | 4.2% |
| 9 | Anhui | 2,939,478 | 13,988,287 | -20.9% | 64.5% |
| 10 | Hebei | 4,965,324 | 13,686,108 | 94.4% | 79.2% |
Guangdong and Zhejiang are major original delivered places of China Tubes, pipes and hoses, and fittings of plastics. The exports volume of both places hold 61.05% of whole exports, and exports value takes a 58.74% of whole value. At top ten original delivered places of China Tubes, pipes and hoses, and fittings of plastics, the largest export amount and value increasing place are Hebei, which take a 94.4% and 79.2% growth as before ; Anhui is next, the export value increased 64.5% as before.
The Export Analysis of China Tubes, Pipes and Hollow Profiles of Cast Iron(HS: 7303) between Jan - May 2013
The Export Amount and Value of China Tubes, Pipes and Hollow Profiles of Cast Iron between Jan - May 2013
| Month | Amount(Kg) | Value(USD) | Compared with the same period of last year | |
|
|
|
| Amount | Value |
| Jan | 55,918,073 | 49,513,796 | -41.4% | -43% |
| Feb | 39,921,229 | 49,304,637 | 34.1% | 84.4% |
| Mar | 31,630,264 | 27,452,943 | -58.6% | -57.8% |
| Apr | 54,180,784 | 47,624,563 | 62.2% | 50.4% |
| May | 55,443,804 | 47,291,094 | -49.4% | -50.2% |
| Total | 237,094,154 | 221,187,033 | -31.2% | -27.5% |
In first five months of 2013, China export amount of China Tubes, pipes and hollow profiles of cast iron reached 237.1 thousand tons, dropped 31.2% as before; export value reached $ 221 million, dropped 27.5% as before.
The Major Import Countries/Regions of China Tubes, Pipes and Hollow Profiles of Cast Iron between Jan - May 2013
| No. | Country | Amount(Kg) | Value(USD) | Compared with the same period of last year | |
|
|
|
|
| Amount | Value |
| 1 | Saudi Arabia | 42,599,192 | 30,000,845 | -71.7% | -75.2% |
| 2 | Ethiopia | 15,338,795 | 25,242,387 | 679.9% | 1519.1% |
| 3 | Iraq | 15,689,314 | 13,219,306 | 34.3% | 24.3% |
| 4 | Algeria | 18,225,901 | 12,730,791 | 34.3% | 18.1% |
| 5 | HK | 7,532,989 | 8,303,852 | 3.4% | 10% |
| 6 | USA | 8,198,517 | 8,142,304 | -4.8% | -6.9% |
| 7 | Singapore | 8,686,107 | 7,906,566 | 19.4% | 16.3% |
| 8 | Vietnam | 9,049,142 | 7,258,253 | 111.2% | 97.4% |
| 9 | South Africa | 7,523,928 | 5,975,231 | 10.2% | 1.2% |
| 10 | Carbon | 6,899,529 | 5,884,874 | 1402243.3% | 637481% |
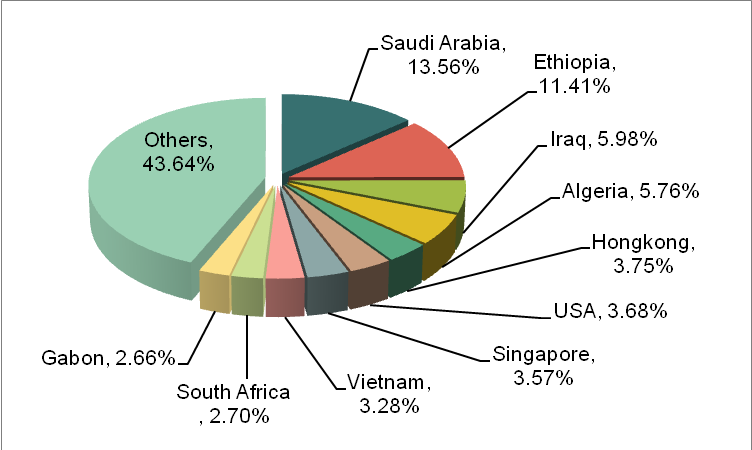
At the top ten exports countries/regions, the largest increasing export amount and value country are Carbon, which takes a 1402243.3% and 637481% growth; the next is Ethiopia, the export amount increases 679.9%, and export value increases 1519.1%.
Original Goods Delivered Place of China Tubes, Pipes and Hollow Profiles of Cast Iron
| No. | Regions | Amount(Kg) | Value(USD) | Compared with the same period of last year | |
|
|
|
|
| Amount | Value |
| 1 | Hebei | 89,072,371 | 82,538,155 | -8.5% | -5% |
| 2 | Shanxi | 58,107,698 | 49,597,857 | -12.8% | -13.2% |
| 3 | Jiangsu | 20,486,647 | 20,681,467 | -36.8% | -25.4% |
| 4 | Shandong | 21,007,291 | 16,358,193 | -44.6% | -50.2% |
| 5 | Anhui | 21,176,550 | 15,614,876 | -16.4% | -26.9% |
| 6 | Zhejiang | 3,764,929 | 9,593,042 | 17.7% | 36.3% |
| 7 | Guangdong | 3,470,018 | 7,590,152 | -42.1% | 27.5% |
| 8 | Henan | 6,775,580 | 5,426,115 | -73.8% | -74.4% |
| 9 | Liaoning | 3,015,120 | 2,852,621 | -92% | -91.1% |
| 10 | Hubei | 2,936,662 | 2,504,038 | 4831.8% | 3019.5% |
Hebei, Shanxi, Jiangsu, Shandong and Anhui are major original delivered places of China Tubes, pipes and hoses, and fittings of cast iron. The exports volume of five places hold 88.51% of whole exports, and exports value takes a 83.54% of whole value at 1-5 of 2013. At top ten original delivered places of China Tubes, pipes and hoses, and fittings of cast iron, the largest export amount and value increasing place are Hubei, which take a 4831.8% and 3019.5% growth as before.
The Export Analysis of China Seamless Tubes & Pipes and Hollow Profiles of Iron or Steel (HS: 7304)between Jan - May 2013
The Export Amount and Value of China Seamless Tubes & Pipes and Hollow Profiles of Iron or Steel between Jan - May 2013
| Month | Amount(Kg) | Value(USD) | Compared | |
| Amount | Value | |||
| Jan | 442,064,989 | 575,234,136 | 8.4% | -5.4% |
| Feb | 432,606,931 | 555,982,530 | 35% | 25.9% |
| Mar | 415,304,022 | 528,201,948 | -5.2% | -13% |
| Apr | 459,290,444 | 616,851,676 | 25.2% | 17.9% |
| May | 469,284,431 | 627,393,877 | -2.1% | -6% |
| Total | 2,218,550,817 | 2,903,664,167 | 10.2% | 2% |
In first five months of 2013, China export amount of seamless tubes & pipes and hollow profiles of Iron or steel reached 2.22 million thousand tons, increased 10.2% as before; export value reached $ 2.9 billion, increased 2% as before.
The Major Import Countries/Regions of China Seamless Tubes & Pipes and Hollow Profiles of Iron or Steel between Jan - May 2013
| No. | Country | Amount(Kg) | Value(USD) | Compared with the same period of last year | |
|
|
|
|
| Amount | Value |
| 1 | Korea | 151,313,996 | 188,607,182 | 7.7% | -9.8% |
| 2 | Venezuela | 132,859,572 | 187,496,168 | 107.4% | 160.4% |
| 3 | Russia | 137,742,739 | 176,912,152 | 456.6% | 219.4% |
| 4 | India | 114,731,942 | 172,454,512 | -31.8% | -42.9% |
| 5 | UAE | 138,244,156 | 157,644,918 | 25.2% | 15.5% |
| 6 | Iran | 82,570,527 | 124,214,366 | -40.9% | -40% |
| 7 | Kazakhstan | 73,525,364 | 120,711,924 | 65.5% | 67.4% |
| 8 | Turkey | 88,582,328 | 106,574,196 | 73.5% | 89.7% |
| 9 | Iraq | 69,351,004 | 91,593,927 | 20.9% | 15% |
| 10 | USA | 36,328,127 | 85,300,786 | -44.7% | -44% |
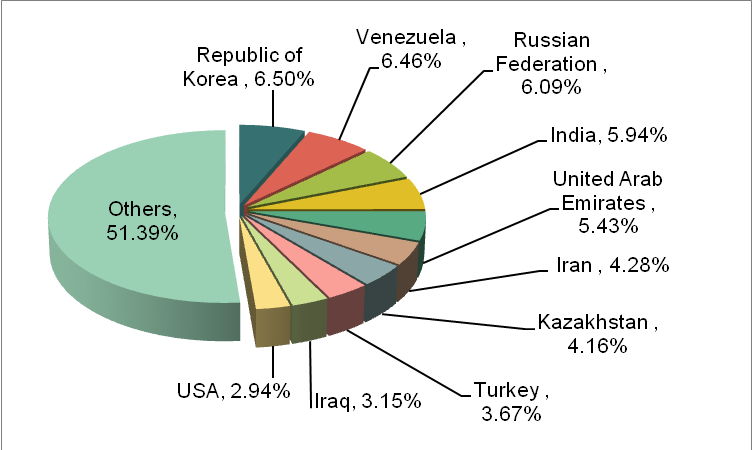
At the top ten imports countries/regions of China seamless tubes & pipes and hollow profiles of Iron or steel, six of them increased import value than before. The largest increasing amount and value country is Russia, which takes a 456.6% and 219.4% growth; the next is Venezuela, the export value increases 160.4%.
Original Goods Delivered Place of China Seamless Tubes & Pipes and Hollow Profiles of Iron or Steel
| No. | Regions | Amount(Kg) | Value(USD) | Compared with the same period of last year | |
|
|
|
|
| Amount | Value |
| 1 | Jiangsu | 595,777,038 | 850,091,989 | 18.1% | 14.1% |
| 2 | Tianjin | 442,033,910 | 555,222,441 | 39.4% | 26.6% |
| 3 | Hunan | 261,241,785 | 290,307,687 | 8.6% | -9.3% |
| 4 | Shandong | 203,884,138 | 228,230,656 | -10.9% | -9.9% |
| 5 | Zhejiang | 58,626,854 | 223,922,195 | 0.1% | -7.3% |
| 6 | Shanghai | 110,624,625 | 169,360,914 | 4.4% | -2.6% |
| 7 | Sichuan | 151,425,100 | 158,961,123 | 24.4% | -1.4% |
| 8 | Hebei | 158,591,555 | 151,963,294 | -13.3% | -17.9% |
| 9 | Anhui | 101,453,736 | 89,033,982 | 5.9% | -3.6% |
| 10 | Hubei | 57,041,080 | 63,665,851 | -8.6% | -31.6% |
Tianjin, Hunan, Jiangsu and Shandong are major original delivered places of China seamless tubes & pipes and hollow profiles of Iron or steel. The four places exports volume hold 67.74% of whole exports, and exports value takes a 66.26% of whole value at 1-5 of 2013. At top ten original delivered places of China seamless tubes & pipes and hollow profiles of Iron or steel, the largest export amount and value increasing place are Tianjin, which take a 39.4% and 26.6% growth as before.
The Export Analysis of China Circular Cross-Sections Tubes and Pipes of Iron or Steel (HS: 7305)between Jan - May 2013
The Export Amount and Value of China Circular Cross-Sections Tubes and Pipes of Iron or Steel between Jan - May 2013
| Month | Amount(Kg) | Value(USD) | Compared with the same period of last year | |
|
|
|
| Amount | Value |
| Jan | 111,401,063 | 122,932,464 | -0.9% | -3.4% |
| Feb | 84,421,975 | 87,815,651 | -19.8% | -29.7% |
| Mar | 113,859,142 | 128,980,044 | -15.8% | -16.7% |
| Apr | 153,952,274 | 170,613,286 | 98.9% | 71.4% |
| May | 132,175,678 | 151,124,861 | 0.4% | -4.3% |
| Total | 595,810,132 | 661,466,306 | 6% | -0.4% |
In first five months of 2013, China export amount of circular cross-sections tubes and pipes of iron or steel reached 595.8 thousand tons, increased 6% as before; export value reached $ 661 million, increased 0.4% as before.
The Major Import Countries/Regions of China Circular Cross-Sections Tubes and Pipes of Iron or Steel(HS: 7305)between Jan - May 2013
| No. | Country | Amount(Kg) | Value(USD) | Compared with the same period of last year | |
|
|
|
|
| Amount | Value |
| 1 | Uzbekistan | 129,011,124 | 186,137,425 | 8229.7% | 7535.4% |
| 2 | Kazakhstan | 81,393,715 | 118,238,162 | 548.9% | 499.3% |
| 3 | Canada | 55,695,535 | 44,414,689 | -6.8% | -18.3% |
| 4 | Saudi Arabia | 34,930,737 | 32,402,263 | 722.6% | 570.3% |
| 5 | Turkmenistan | 14,106,827 | 23,215,815 | -55.9% | -60.8% |
| 6 | Venezuela | 18,308,757 | 19,842,437 | 169.2% | 170.4% |
| 7 | HK | 24,242,936 | 19,003,449 | 75.8% | 41.3% |
| 8 | Cameroon | 16,648,063 | 16,778,418 | 13432.6% | 14539% |
| 9 | Peru | 19,818,617 | 14,337,532 | 406.8% | 351.3% |
| 10 | Iran | 11,941,479 | 12,671,706 | 7.6% | -19.5% |
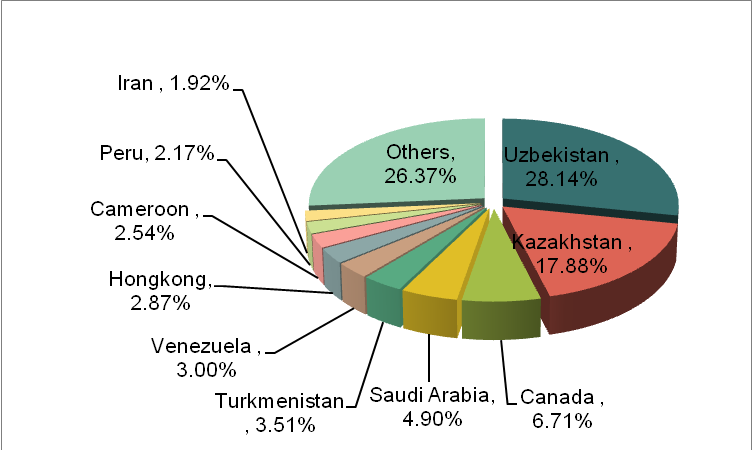
At the top ten imports countries/regions of China circular cross-sections tubes and pipes of iron or steel, seven of them increased import value than before. The largest increasing amount and value country is Cameroon, which takes a 13432.6% and 14539% growth; the next is Uzbekistan, the exports increases 7535.4%.
Original Goods Delivered Place of China Circular Cross-Sections Tubes and Pipes of Iron or Steel
| No. | Region | Amount(Kg) | Value(USD) | Compared with the same period of last year | |
|
|
|
|
| Amount | Value |
| 1 | Beijing | 215,609,850 | 305,330,186 | 521.8% | 552.9% |
| 2 | Liaoning | 79,881,300 | 63,548,060 | 62.8% | 49.6% |
| 3 | Jiangsu | 59,266,761 | 62,679,569 | 76.6% | 62.3% |
| 4 | Shanghai | 52,447,670 | 56,753,989 | -16.2% | -18.6% |
| 5 | Hebei | 62,536,942 | 55,501,234 | -67.1% | -78.5% |
| 6 | Guangdong | 53,096,812 | 48,885,955 | -40% | -50% |
| 7 | Zhejiang | 25,500,819 | 22,242,730 | -14.3% | -24.5% |
| 8 | Tianjin | 24,172,257 | 21,147,807 | -1.8% | 4.9% |
| 9 | Anhui | 8,561,477 | 7,126,046 | 62.3% | 23.6% |
| 10 | Hunan | 2,360,520 | 4,971,146 | 57474% | 136096% |
Beijing is major original delivered places of China circular cross-sections tubes and pipes of iron or steel. The exports volume hold 36.19% of whole exports, and exports value takes a 46.16% of whole value at 1-5 of 2013. At top ten original delivered places of China circular cross-sections tubes and pipes of iron or steel, the largest export amount and value increasing place is Hunan, which take a 57474% and 136096% growth as before; the next is Beijing, the export value increases 552.9%.
The Export Analysis of China Other Tubes & Pipes and Hollow Profiles of Iron or Steel(HS: 7306)between Jan - May 2013
The Export Amount and Value of China Other Tubes & Pipes and Hollow Profiles of Iron or Steel between Jan - May 2013
| Month | Amount(Kg) | Value(USD) | Compared with the same period of last year | |
|
|
|
| Amount | Value |
| Jan | 224,547,037 | 229,975,846 | 22.2% | 18.7% |
| Feb | 157,760,347 | 165,717,380 | 32.2% | 43.9% |
| Mar | 158,560,256 | 175,006,495 | -35.7% | -23.7% |
| Apr | 228,106,060 | 225,936,219 | 6.6% | 7.4% |
| May | 255,722,846 | 263,792,923 | 15.7% | 11.5% |
| Total | 1,024,696,546 | 1,060,428,863 | 4.1% | 7.6% |
In first five months of 2013, China export amount of other tubes & pipes and hollow profiles of iron or steel reached 1.02 million thousand tons, increased 4.1% as before; export value reached $ 1.06 billion, increased 7.6% as before.
The major import countries/regions of other tubes & pipes and hollow profiles of iron or steel between Jan - May 2013
| No. | Country | Amount(Kg) | Value(USD) | Compared with the same period of last year | |
|
|
|
|
| Amount | Value |
| 1 | Thailand | 44,976,882 | 50,896,484 | 101.9% | 95.9% |
| 2 | Australia | 47,201,624 | 44,928,168 | -31.8% | -32.3% |
| 3 | Indonesia | 33,946,900 | 44,528,641 | -26.1% | -7.4% |
| 4 | Singapore | 45,401,462 | 44,494,421 | 32.7% | 22.8% |
| 5 | Chile | 53,309,968 | 43,643,545 | 14.6% | 4.3% |
| 6 | Philippines | 47,594,945 | 38,610,888 | 39.2% | 26.7% |
| 7 | India | 17,262,003 | 36,632,683 | 1% | 60.1% |
| 8 | HK | 35,252,403 | 34,407,435 | -11% | -9.8% |
| 9 | Malaysia | 21,831,925 | 34,218,962 | 31.4% | 101.3% |
| 10 | Venezuela | 42,317,104 | 34,189,154 | 72.6% | 32.9% |
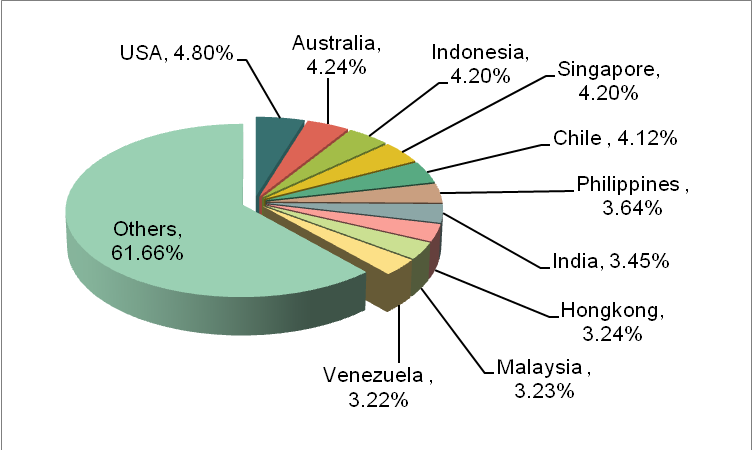
At the top ten imports countries/regions of China other tubes & pipes and hollow profiles of iron or steel, the largest increasing amount country is Thailand, which takes a 95.9% growth and largest increasing value country is Malaysia, the exports increases 101.3%.
Original Goods Delivered Place of China Other Tubes & Pipes and Hollow Profiles of Iron or Steel
| No. | Region | Amount(Kg) | Value(USD) | Compared with the same period of last year | |
|
|
|
|
| Amount | Value |
| 1 | Guangdong | 124,599,005 | 256,303,546 | 0.1% | 45.3% |
| 2 | Tianjin | 329,779,946 | 239,043,328 | 13.6% | 4.7% |
| 3 | Hebei | 167,990,345 | 130,511,366 | 12.8% | 6.2% |
| 4 | Liaoning | 133,485,388 | 107,471,936 | 0.5% | -2.7% |
| 5 | Jiangsu | 51,921,882 | 65,880,924 | -20.7% | -23% |
| 6 | Zhejiang | 27,648,277 | 51,499,953 | -12.1% | -10.2% |
| 7 | Shnaghai | 39,864,363 | 40,695,281 | 18.5% | -2.2% |
| 8 | Shandong | 43,533,950 | 36,963,030 | -28.8% | -36.8% |
| 9 | Fujian | 22,146,162 | 26,691,253 | 3.3% | 6.5% |
| 10 | Sichuan | 3,768,912 | 24,769,909 | -3.4% | 453.5% |
Guangdong, Tianjin, Hebei and Liaoning are major original delivered places of China other tubes & pipes and hollow profiles of iron or steel. The four places exports volume hold 73.76% of whole exports, and exports value takes a 69.15% at 1-5 of 2013. At top ten original delivered places of goods, the largest export amount is Shanghai, which takes a 18.5% growth as before; and the largest export value increasing place is Sichuan, which takes 453.5% growth as before.
The Export Analysis of China Tube or Pipe Fittings of Iron or Steel between(HS: 7307) Jan - May 2013
The Export Amount and Value of China Tube or Pipe Fittings of Iron or Steel between Jan - May 2013
| Month | Amount(Kg) | Value(USD) | Compared with the same period of last year | |
|
|
|
| Amount | Value |
| Jan | 133,319,168 | 345,313,942 | 1% | -7.2% |
| Feb | 101,650,765 | 257,469,780 | 49% | 34.7% |
| Mar | 100,478,963 | 270,954,046 | -21.9% | -21.8% |
| Apr | 135,819,955 | 341,084,431 | -3.7% | -7.8% |
| May | 156,878,132 | 391,277,651 | 6.3% | -1.4% |
| Total | 628,146,983 | 1,606,099,850 | 1.7% | -4.2% |
In first five months of 2013, China export amount of tube or pipe fittings of iron or steel reached 628.1 thousand tons, increased 1.7% as before; export value reached $ 1.60 billion, increased 4.2% as before.
The Major Import Countries/Regions
| No. | Country | Amount(Kg) | Value(USD) | Compared with the same period of last year | |
|
|
|
|
| Amount | Value |
| 1 | USA | 130,789,427 | 363,988,568 | 2.4% | -4.3% |
| 2 | Japan | 37,255,459 | 130,407,769 | -1% | -5.7% |
| 3 | Korea | 48,432,497 | 104,729,355 | -1.3% | -9.3% |
| 4 | Germany | 18,653,914 | 68,682,740 | -14.9% | -18.3% |
| 5 | Russia | 23,401,034 | 46,162,229 | 38% | 27% |
| 6 | Italy | 17,243,875 | 43,787,428 | 1.3% | -7.4% |
| 7 | Taiwan | 18,750,845 | 40,542,700 | 18.5% | 5.9% |
| 8 | Singapore | 14,764,674 | 39,838,188 | 5.8% | -1.2% |
| 9 | Malaysia | 21,767,891 | 39,304,576 | 25% | 16.4% |
| 10 | Canada | 14,512,206 | 38,108,491 | -1.3% | -12.8% |
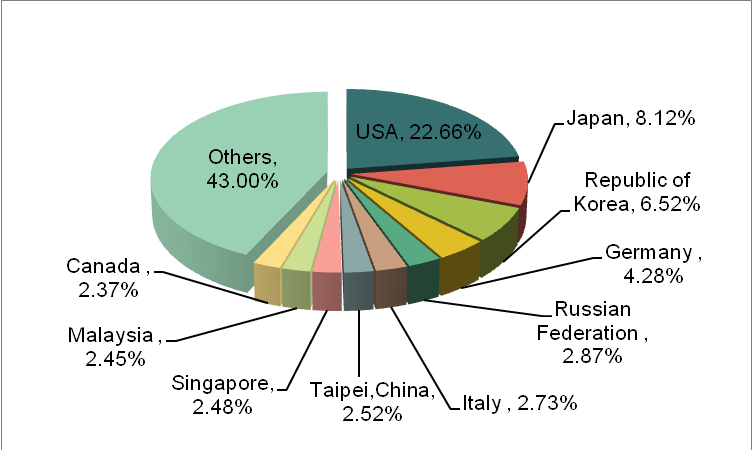
At the top ten imports countries/regions of China tube or pipe fittings of iron or steel, the largest increasing amount country is Malaysia, which takes a 25% growth and largest increasing value country is Russia, the exports increases 27%.
Original Goods Delivered Place of China Tube or Pipe Fittings of Iron or Steel
| No. | Regions | Amount(Kg) | Value(USD) | Compared with the same period of last year | |
|
|
|
|
| Amount | Value |
| 1 | Jiangsu | 62,821,719 | 293,610,158 | -6.5% | -15.1% |
| 2 | Shandong | 137,427,092 | 279,495,189 | 3.1% | -0.8% |
| 3 | Hebei | 137,646,765 | 231,780,886 | 6.6% | 2.2% |
| 4 | Zhejiang | 42,884,535 | 189,129,260 | 1.4% | -3.4% |
| 5 | Liaoning | 55,532,710 | 123,603,438 | -8.2% | -12.7% |
| 6 | Shanxi | 72,103,561 | 121,830,867 | 11.5% | 0.6% |
| 7 | Shanghai | 22,306,736 | 101,463,004 | -14.9% | -7.7% |
| 8 | Tianjin | 36,421,254 | 77,561,707 | 10.2% | -4.8% |
| 9 | Guangdong | 13,689,533 | 45,847,886 | -3.8% | 29.3% |
| 10 | Beijing | 16,934,642 | 40,952,225 | 0.4% | -5.6% |
Jiangsu, Shandong and Hebei are major original delivered places of China tube or pipe fittings of iron or steel. The three places exports volume hold 53.79% of whole exports, and exports value takes a 50.11% of whole value at 1-5 of 2013. At top ten original delivered places of goods, the largest export amount is Shanxi, which takes a 11.5% growth as before; and the largest export value increasing place is Guangdong, which takes 29.3% growth as before.
The Export Analysis of China Copper Pipes(HS: 7411) between Jan - May 2013
The Export Amount and Value of Copper Pipes between Jan - May 2013
| Month | Amount(Kg) | Value(USD) | Compared with the same period of last year | |
|
|
|
| Amount | Value |
| Jan | 13,623,651 | 125,938,545 | 13.2% | 16.4% |
| Feb | 11,750,647 | 106,982,130 | -1.4% | -0.5% |
| Mar | 18,135,244 | 163,606,162 | 18.9% | 14.7% |
| Apr | 17,090,723 | 151,635,415 | 19.2% | 11.9% |
| May | 16,671,383 | 145,150,147 | -2.2% | -9.1% |
| Total | 77,271,648 | 693,312,399 | 9.5% | 6.1% |
In first five months of 2013, China export amount of copper pipes reached 77.3 thousand tons, increased 9.5% as before; export value reached $ 693 million, increased 6.1% as before.
The Major Import Countries/Regions of Copper Pipes
| No | Country | Amount(Kg) | Value(USD) | Compared with the same period of last year | |
|
|
|
|
| Amount | Value |
| 1 | USA | 8,771,949 | 80,640,478 | -1.4% | -4.9% |
| 2 | Thailand | 8,644,862 | 75,843,999 | 42.4% | 36.6% |
| 3 | Taiwan | 7,861,769 | 67,101,938 | -4% | -5.9% |
| 4 | Malaysia | 5,559,940 | 49,648,304 | 23.3% | 18.7% |
| 5 | Japan | 5,438,662 | 48,692,689 | 31.1% | 24.3% |
| 6 | Saudi Arabia | 4,433,405 | 38,977,248 | 20.3% | 16.4% |
| 7 | Korea | 4,138,160 | 38,507,546 | 54.5% | 46% |
| 8 | India | 3,159,658 | 28,614,645 | -14.4% | -16.1% |
| 9 | Indonesia | 2,610,294 | 23,896,914 | 28.6% | 25.2% |
| 10 | Brazil | 2,034,962 | 17,788,069 | 65.9% | 57.9% |
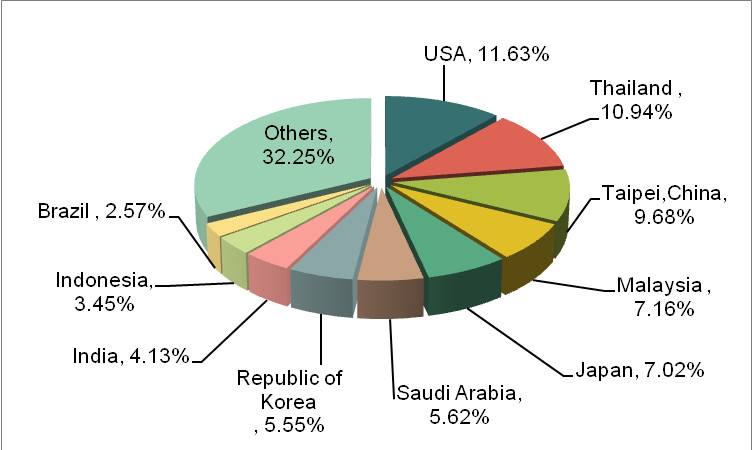
At the top ten imports countries/regions of China copper pipes, the largest increasing amount/value country is Brazil, which takes a 65.9% and 57.9% growth year by year.
Original Goods Delivered Place of China Copper Tube
| No | Regions | Amount( Kg) | Value(USD) | Compared with the same period of last year | |
|
|
|
|
| Amount | Value |
| 1 | Zhejiang | 22,313,898 | 199,286,059 | 10.7% | 7.1% |
| 2 | Shanghai | 18,004,658 | 160,471,756 | 14.3% | 10.3% |
| 3 | Henan | 16,338,664 | 145,797,516 | -3.4% | -5.8% |
| 4 | Guangdong | 8,005,239 | 74,239,196 | -3.1% | -3.3% |
| 5 | Jiangsu | 4,829,592 | 44,644,724 | 4.2% | 2.9% |
| 6 | Guangxi | 3,059,427 | 25,257,268 | 19.2% | 13.8% |
| 7 | Chongqing | 1,952,026 | 16,856,551 | 1594% | 1354% |
| 8 | Jiangxi | 828,592 | 7,895,650 | -7.2% | -10% |
| 9 | Shandong | 849,995 | 7,264,848 | 40.1% | 25.1% |
| 10 | Fujian | 193,038 | 3,233,645 | -22.8% | -7.7% |
Zhejiang, Shanghai and Henan are major original delivered places of China copper pipes. The three places exports volume hold 73.32% of whole exports, and exports value takes a 72.92% of whole value at 1-5 of 2013. At top ten original delivered places of goods, the largest export amount and value is Chongqing, which takes a 1594% and 1354% growth as before.
The Export Analysis of China Aluminum Pipes (HS: 7608)between Jan - May 2013
The Export Amount and Value of Aluminum Pipes between Jan - May 2013
| Month | Amount(Kg) | Value(USD) | Compared with the same period of last year | |
|
|
|
| Amount | Value |
| Jan | 8,309,656 | 32,331,465 | 23.5% | 21.9% |
| Feb | 4,746,223 | 19,674,250 | 9.8% | 14.6% |
| Mar | 6,840,738 | 27,999,976 | -2.4% | 2.6% |
| Apr | 7,409,253 | 30,874,763 | 13.5% | 20.6% |
| May | 7,936,730 | 32,381,412 | 2.7% | 5.9% |
| Total | 35,242,600 | 143,261,866 | 9% | 12.7% |
In first five months of 2013, China export amount of aluminum pipes reached 35.2 thousand tons, increased 9% as before; export value reached $ 143 million, increased 12.7% as before.
The Major Import Countries/Regions of Aluminum Pipes
| No | Country | Amount(Kg) | Value(USD) | Compared with the same period of last year | |
|
|
|
|
| Amount | Value |
| 1 | Thailand | 2,569,086 | 10,496,908 | 155.8% | 156.1% |
| 2 | Unit States | 1,486,232 | 7,780,091 | 19.6% | 7.1% |
| 3 | Korea | 1,128,269 | 7,249,824 | 143.4% | 147.5% |
| 4 | Mexico | 1,625,899 | 7,058,320 | 152.7% | 114.1% |
| 5 | Australia | 2,209,812 | 6,800,127 | -5.8% | -10.2% |
| 6 | HK | 1,349,819 | 6,726,689 | 0.3% | 19.2% |
| 7 | Russia | 1,487,972 | 5,896,533 | -2.3% | 0.7% |
| 8 | UK | 1,818,088 | 5,636,370 | 14.1% | 4.8% |
| 9 | India | 1,262,125 | 5,506,168 | -0.6% | -0.7% |
| 10 | Malaysia | 1,148,794 | 4,699,033 | 11.1% | 14.8% |
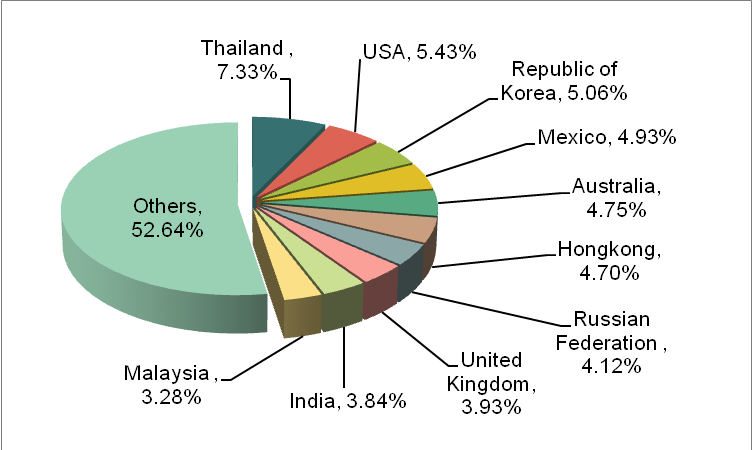
At the top ten imports countries/regions of China aluminum pipes, the largest increasing amount & value country is Thailand, which takes a 155.8% and 156.1% growth year by year; the next is Korea; the exports increased 147.5% as before.
Original Goods Delivered Place of China Aluminum Pipes
| No. | Regions | Amount(Kg) | Value(USD) | Compared with the same period of last year | |
|
|
|
|
| Amount | Value |
| 1 | Guangdong | 13,673,520 | 53,344,871 | 4.3% | 9% |
| 2 | Jiangsu | 6,730,102 | 29,846,040 | 5.3% | 8.2% |
| 3 | Zhejiang | 6,934,180 | 29,179,593 | -7.4% | -6.4% |
| 4 | Shanghai | 1,491,436 | 6,645,716 | 43.3% | 63.5% |
| 5 | Shandong | 1,075,642 | 4,147,127 | 37.4% | 28.4% |
| 6 | Fujian | 1,057,712 | 3,700,539 | 15.9% | 33.6% |
| 7 | Liaoning | 739,205 | 2,801,085 | 87.5% | 116.5% |
| 8 | Hebei | 693,159 | 2,212,545 | 754.6% | 628.5% |
| 9 | Guangxi | 716,341 | 2,097,656 | -19.3% | -25.7% |
| 10 | Anhui | 379,962 | 2,022,757 | 32% | 40.7% |
Zhejiang, Guangdong and Jiangsu are major original delivered places of China aluminum pipes. The three places exports volume hold 77.57% of whole exports, and exports value takes a 78.44% of whole value at 1-5 of 2013. At top ten original delivered places of goods, the largest export amount and value is Hebei, which takes a 754.6% and 628.5% growth as before.
Data Source: China Custom


