| HS Code | Product Name |
| 8528 | Monitors and projectors, not incorporating television reception apparatus: reception apparatus for television, whether or not incorporating radiobroad cast receivers or sound or video recording or reproducing apparatus, the following text referred to as "TV". |
Chinese TV (HS: 8528) Export Volume and Value from Jan. to May in 2013
| Month | Volume (Set) | Value (USD) | Year on Year | |
|
|
|
| Volume | Value |
| January | 20,179,229 | 1,890,454,699 | -4.5% | -7.7% |
| February | 17,009,944 | 1,617,193,369 | 5.2% | -8.6% |
| March | 23,253,746 | 2,145,365,120 | 0.3% | -8.8% |
| April | 24,920,903 | 2,167,403,743 | 9.4% | -2.7% |
| May | 23,058,097 | 2,201,291,776 | -6% | -10% |
| Jan.-May Total | 108,421,919 | 10,021,708,707 | 0.6% | -7.6% |
Chinese TV export value amounted to 10.022 billion U.S. dollars from Jan. to May in 2013, with a decrease of 7.6%.
Chinese TV (HS: 8528) Main Export Countries/Regions Distribution from Jan. to May in 2013
| No. | Country | Volume (Set) | Value (USD) | Year on Year | |
|
|
|
|
| Volume | Value |
| 1 | USA | 19,683,704 | 3,021,996,107 | -21% | -20.8% |
| 2 | Netherlands | 6,880,701 | 1,009,025,856 | -16.4% | -7.6% |
| 3 | Japan | 3,042,759 | 690,802,611 | -26.3% | -20.6% |
| 4 | Hong Kong | 8,986,343 | 465,242,048 | 44.9% | 4.9% |
| 5 | India | 13,964,062 | 443,404,944 | 96.7% | 36.8% |
| 6 | UK | 2,517,229 | 250,451,621 | -22.7% | -10.4% |
| 7 | UAE | 4,120,319 | 250,315,117 | -16.8% | 5.1% |
| 8 | Brazil | 2,187,883 | 226,801,648 | 26.2% | 50.5% |
| 9 | Germany | 2,012,886 | 221,687,800 | -50.1% | -12.7% |
| 10 | Australia | 1,217,156 | 212,697,425 | -1.6% | 0.9% |
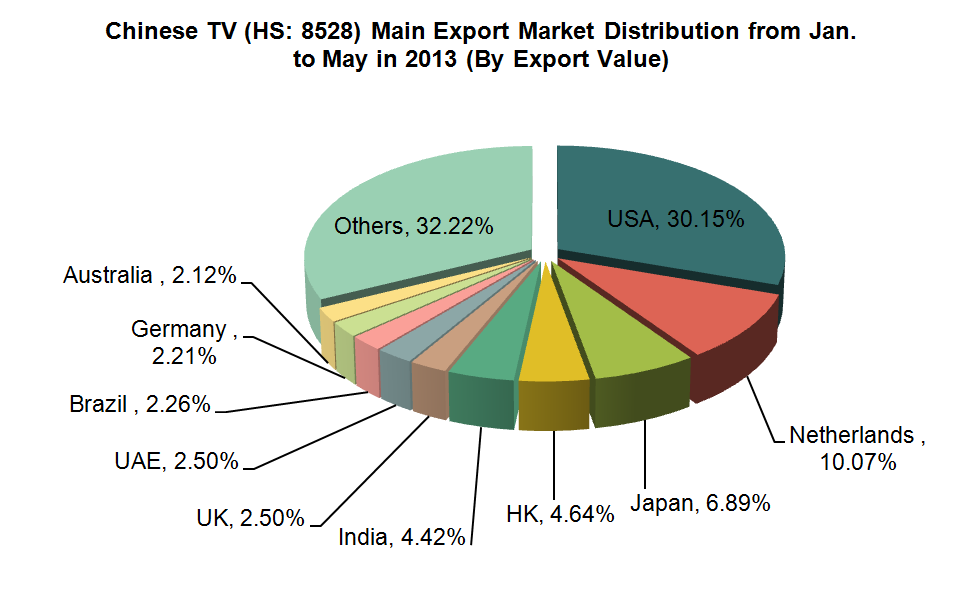
From Jan. to May in 2013, among the top ten export destination countries/regions, from the export volume year on year, there was a larger increase in India (with an increase of 96.7% year on year). From the export value year on year, there was a larger increase in Brazil (with an increase of 50.5% year on year).
Chinese TV (HS: 8528) Main Export Source Area from Jan. to May in 2013
| No. | Region | Volume (Set) | Value (USD) | Year on Year | |
|
|
|
|
| Volume | Value |
| 1 | Guangdong | 54,206,568 | 3,941,491,443 | -2.1% | -7.9% |
| 2 | Jiangsu | 15,074,219 | 2,346,708,669 | -8.7% | -15.6% |
| 3 | Fujian | 18,404,190 | 1,525,447,522 | 10.4% | 1.4% |
| 4 | Shandong | 1,979,970 | 451,220,959 | 20% | 9.1% |
| 5 | Liaoning | 1,825,915 | 411,020,158 | -25.7% | 2.4% |
| 6 | Chongqing | 3,866,790 | 338,654,927 | 82% | 51.5% |
| 7 | Zhejiang | 1,858,594 | 241,118,012 | -18.4% | -27.9% |
| 8 | Shanghai | 1,325,559 | 196,124,664 | -46.9% | -34.8% |
| 9 | Hubei | 2,272,738 | 189,549,999 | -7.3% | -8.9% |
| 10 | Tianjin | 1,050,511 | 152,098,784 | -13.8% | -7% |
Guangdong, Jiangsu and Fujian are our TV main export source area. The TV export volume of the above three provinces accounted for 80.87% of total export volume from Jan. to May in 2013, and the export value together accounted for 77.97% of total export value. Among Our top ten TV export source areas, there was the largest increase of both export volume and value in Chongqing Province, with an increase of 82% year on year of export volume and 51.5% year on year of export value.
(Source: China Customs)


