Export Quantity&Value for Dog or Cat Food put up for Retail Sale (HS: 230910) from Jan. to Sep. in 2012
| Month | Quantity (Kg) | Value (USD Thousand) | Year on Year (±%) (Quantity) | Year on Year (±%) (Value) |
| Jan. | 11,458,117 | 69,331.4 | 4.5% | 11.5% |
| Feb. | 7,213,966 | 43,706.5 | 36.8% | 44.3% |
| Mar. | 10,649,547 | 65,856.7 | 4.1% | 7.9% |
| Apr. | 11,559,731 | 70,109.7 | 9.0% | 13.7% |
| May | 12,568,659 | 76,637.0 | 13.9% | 13.6% |
| Jun. | 12,684,386 | 77,993.0 | 23.5% | 25.5% |
| Jul. | 11,640,423 | 70,902.9 | 6.1% | 6.5% |
| Aug. | 11,681,684 | 73,410.6 | 14.8% | 28.8% |
| Sep. | 11,835,561 | 72,122.9 | 17.4% | 18.7% |
| Total | 101,292,074 | 620,070.7 | 13.0% | 17.2% |
Major Importers for Chinese Dog or Cat Food put up for Retail Sale (HS: 230910) from Jan. to Sep. in 2012 (Sorted by Value)
| No. | Countries/ Regions | from Jan. to Sep. in 2012 | Year on Year (±%) | ||
|
|
| Quantity (Kg) | Value (USD Thousand) | Quantity | Value |
| 1 | USA | 52,112,911 | 350,188.5 | 16.2% | 13.5% |
| 2 | Japan | 18,885,880 | 103,956.3 | -3.1% | 7.3% |
| 3 | Germany | 6,191,199 | 39,190.2 | 16.4% | 40.0% |
| 4 | Republic of Korea | 3,507,062 | 23,801.8 | 6.7% | 11.6% |
| 5 | United Kingdom | 5,035,697 | 21,244.7 | 17.0% | 25.4% |
| 6 | Canada | 2,599,118 | 18,648.4 | 52.9% | 66.8% |
| 7 | Netherlands | 1,425,593 | 8,969.5 | 48.0% | 65.8% |
| 8 | Belgium | 1,910,055 | 8,619.4 | 6.2% | 21.9% |
| 9 | Finland | 988,878 | 5,256.0 | 62.0% | 99.5% |
| 10 | Sweden | 1,049,690 | 4,995.3 | 44.1% | 55.7% |
| 11 | Czech Republic | 877,451 | 4,591.0 | 62.9% | 78.0% |
| 12 | Russian Federation | 506,789 | 4,213.2 | 99.9% | 141.9% |
| 13 | Hong Kong | 839,215 | 3,593.3 | 36.6% | 26.4% |
| 14 | Italy | 711,586 | 2,824.4 | 1.5% | 11.7% |
| 15 | France | 701,991 | 2,788.6 | 5.8% | 9.6% |
| 16 | Denmark | 620,693 | 2,608.0 | -21.8% | -12.6% |
| 17 | Australia | 420,116 | 2,455.8 | -6.2% | 15.1% |
| 18 | Chinese Taipei | 330,910 | 1,446.8 | -13.9% | -11.5% |
| 19 | Singapore | 269,901 | 1,355.3 | 63.5% | 54.1% |
| 20 | Switzerland | 138,759 | 1,104.3 | 17.8% | 31.3% |

Customs' Export Quantity&Value for Dog or Cat Food put up for Retail Sale (HS: 230910) from Jan. to Sep. in 2012 (Sorted by Value)
| No. | By Customs | from Jan. to Sep. in 2012 | Year on Year (±%) | ||
|
|
| Quantity (Kg) | Value (USD Thousand) | Quantity | Value |
| 1 | Shanghai Customs | 41,425,856 | 253,130.7 | 49.0% | 57.5% |
| 2 | Qingdao Customs | 23,426,506 | 147,365.9 | 11.1% | 21.6% |
| 3 | Nanjing Customs | 9,374,311 | 66,809.6 | -38.7% | -41.7% |
| 4 | Tianjin Customs | 8,270,886 | 61,596.1 | 7.8% | 12.9% |
| 5 | Ningbo Customs | 9,789,616 | 44,254.0 | 10.7% | 27.3% |
| 6 | Dalian Customs | 4,345,613 | 32,245.7 | -8.7% | 7.1% |
| 7 | Guangzhou Customs | 1,276,570 | 4,533.5 | 8.1% | 40.1% |
| 8 | Gongbei Customs | 1,815,070 | 3,402.1 | 63.3% | 74.5% |
| 9 | Xiamen Customs | 446,258 | 2,699.0 | -22.8% | 2.2% |
| 10 | Fuzhou Customs | 424,921 | 1,424.8 | 13.8% | 11.4% |
Major Cities/Provinces for Dog or Cat Food put up for Retail Sale (HS: 230910) from Jan. to Sep. in 2012 (Sorted by Value)
| No. | Cities/Provinces | from Jan. to Sep. in 2012 | Year on Year (±%) | ||
|
|
| Quantity (Kg) | Value (USD Thousand) | Quantity | Value |
| 1 | Shandong | 40,279,317 | 287,923.6 | 29.2% | 39.3% |
| 2 | Zhejiang | 26,709,017 | 128,825.2 | 15.9% | 26.6% |
| 3 | Jiangsu | 18,874,590 | 122,162.2 | -11.7% | -18.4% |
| 4 | Liaoning | 4,263,637 | 31,727.0 | -9.8% | 6.2% |
| 5 | Tianjin | 3,007,914 | 18,596.5 | 22.5% | 18.3% |
| 6 | Jiangxi | 1,976,710 | 10,216.7 | 29.5% | 38.1% |
| 7 | Guangdong | 3,484,206 | 9,069.4 | 37.5% | 54.4% |
| 8 | Fujian | 717,222 | 3,551.1 | 18.4% | 25.2% |
| 9 | Henan | 535,099 | 2,442.1 | -2.4% | 4.9% |
| 10 | Chongqing | 534,264 | 1,801.4 | 29.3% | 44.3% |
From Jan. to Sep. in 2012, the total export quantity for dog or cat food put up for retail sale achieved 101 thousand tons, up 13% year-on-year; and the total export value was about 0.62 billion dollars, with a rise of 17.2%.
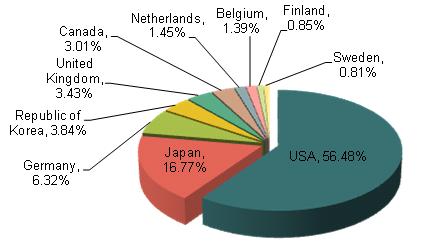
The major importers were USA, Japan and Germany and so on. The export value for USA occupied 56.48% of the total export value. Among the countries mentioned above, export markets for Finland and Russian Federation grew the most, which export values increased 99.5% and 141.9% respectively.
The major exports Customs were Shanghai, Qingdao and Nanjing and so on. In the top 10 exports Customs, Shanghai and Gongbei's export values grew more than 50%, up 57.5% and 74.5% respectively.
The major cities and provinces concentrated in Shandong, Zhejiang and Jiangsu.


