Note:
| HS Code | Product Name |
| 9405 | Lamps and lighting fittings including searchlights and spotlights and parts thereof, not elsewhere specified or included; illuminated signs, illuminated nameplates and the like, having apermanently fixed light source, and parts thereof not elsewhere specified, hereinafter referred to as " Lights & Lighting ". |
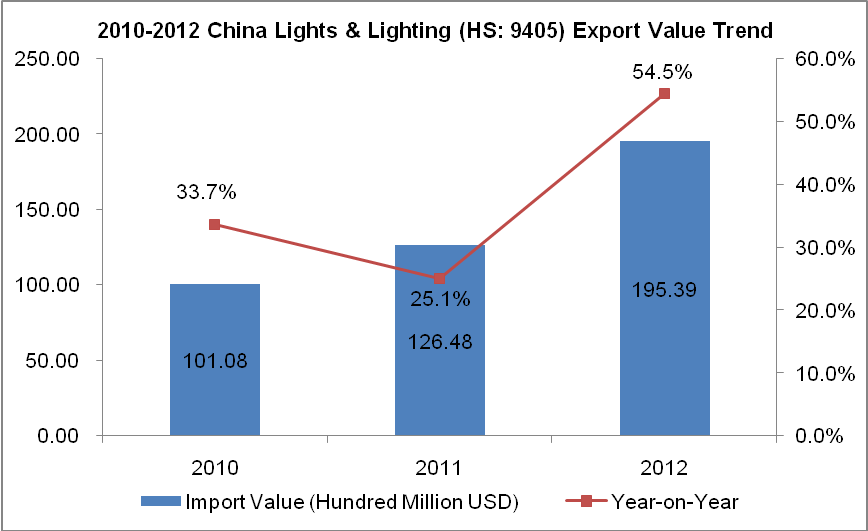
2010-2012 China Lights & Lighting Export Value Trend

As can be seen from the above chart, China lights & lighting export value increased year by year from 2010 to 2012. The export value of 2012 amounted to 19.539 billion US dollars, with an increase of 54.5% compared to the same period of 2011.
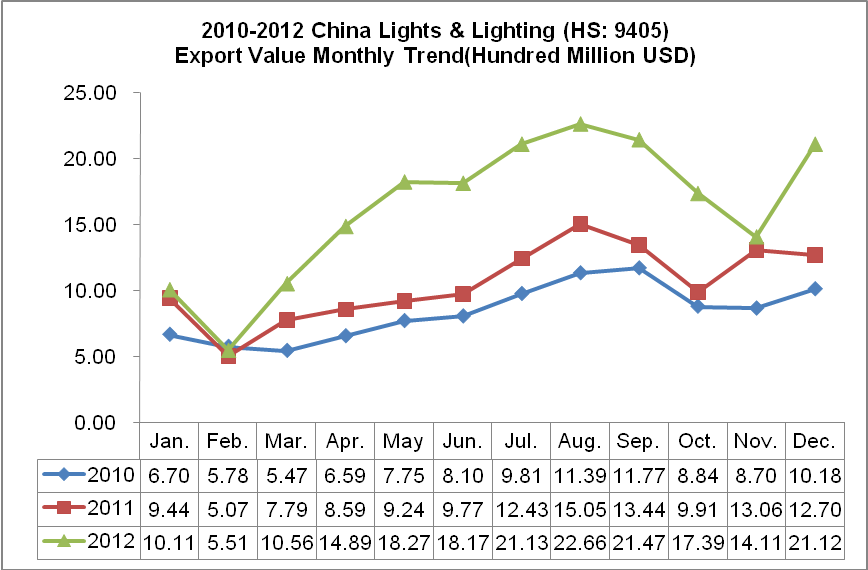
2010-2012 China Lights & Lighting Export Value Monthly Trend

As can be seen from the China lights & lighting monthly export value trend chart from 2010 to 2012, the export value slumped in February.
2010-2012 China Lights & Lighting Export Markets Analysis
| No. | Countries/Regions | Export Value (USD) | Export Value Growth Compared 2012 to 2010 | ||
| 2010 | 2011 | 2012 | |||
| 1 | USA | 2,727,816,311 | 3,364,410,266 | 4,893,051,951 | 79.38% |
| 2 | Germany | 838,443,059 | 1,050,761,331 | 1,392,602,177 | 66.09% |
| 3 | Japan | 341,002,783 | 779,995,358 | 1,123,131,252 | 229.36% |
| 4 | UK | 499,226,727 | 559,727,902 | 954,804,396 | 91.26% |
| 5 | Netherlands | 476,697,400 | 599,196,816 | 844,024,868 | 77.06% |
| 6 | Canada | 331,564,085 | 353,710,054 | 662,999,799 | 99.96% |
| 7 | Hong Kong | 359,802,924 | 468,734,392 | 520,609,745 | 44.69% |
| 8 | Australia | 217,098,878 | 280,357,417 | 482,700,704 | 122.34% |
| 9 | France | 346,320,671 | 389,566,066 | 473,974,813 | 36.86% |
| 10 | Malaysia | 83,636,340 | 139,581,752 | 432,588,057 | 417.22% |
| 11 | Russian Federation | 205,966,834 | 307,680,823 | 370,409,950 | 79.84% |
| 12 | Singapore | 52,177,268 | 66,988,830 | 343,130,151 | 557.62% |
| 13 | Italy | 288,970,512 | 320,278,993 | 336,331,479 | 16.39% |
| 14 | Spain | 211,572,780 | 246,455,090 | 326,377,217 | 54.26% |
| 15 | UAE | 131,232,484 | 149,052,370 | 326,160,312 | 148.54% |
| 16 | Brazil | 88,573,506 | 133,232,085 | 309,447,705 | 249.37% |
| 17 | Belgium | 263,775,867 | 245,326,279 | 304,193,345 | 15.32% |
| 18 | Poland | 130,376,975 | 162,718,633 | 297,414,331 | 128.12% |
| 19 | Indonesia | 70,041,428 | 93,133,625 | 276,276,106 | 294.45% |
| 20 | Saudi Arabia | 65,712,538 | 94,804,213 | 239,400,427 | 264.31% |
The first three largest export markets of China lights & lighting are the USA, Germany and Japan. China's export value to the USA, Germany and Japan in 2012 is 4.893 billion US dollars, 1.393 billion US dollars and 1.123 billion US dollars separately, with an increase of 79.38%, 66.09% and 229.36% compared to 2010. Among the above twenty export markets, the export value of China to Singapore increased the largest, with an increase of 557.62% compared 2012 with 2010, followed by Malaysia, with an increase of 417.22% compared 2012 with 2010.
2010-2012 China Lights & Lighting Export Market Share Analysis
| No. | Countries/Regions | Value Percentage | ||
| 2010 | 2011 | 2012 | ||
| 1 | USA↓ | 26.99% | 26.60% | 25.04% |
| 2 | Germany | 8.30% | 8.31% | 7.13% |
| 3 | Japan | 3.37% | 6.17% | 5.75% |
| 4 | UK | 4.94% | 4.43% | 4.89% |
| 5 | Netherlands | 4.72% | 4.74% | 4.32% |
| 6 | Canada | 3.28% | 2.80% | 3.39% |
| 7 | Hong Kong | 3.56% | 3.71% | 2.66% |
| 8 | Australia↑ | 2.15% | 2.22% | 2.47% |
| 9 | France↓ | 3.43% | 3.08% | 2.43% |
| 10 | Malaysia↑ | 0.83% | 1.10% | 2.21% |
| 11 | Russian Federation | 2.04% | 2.43% | 1.90% |
| 12 | Singapore↑ | 0.52% | 0.53% | 1.76% |
| 13 | Italy↓ | 2.86% | 2.53% | 1.72% |
| 14 | Spain↓ | 2.09% | 1.95% | 1.67% |
| 15 | UAE | 1.30% | 1.18% | 1.67% |
| 16 | Brazil↑ | 0.88% | 1.05% | 1.58% |
| 17 | Belgium↓ | 2.61% | 1.94% | 1.56% |
| 18 | Poland | 1.29% | 1.29% | 1.52% |
| 19 | Indonesia↑ | 0.69% | 0.74% | 1.41% |
| 20 | Saudi Arabia↑ | 0.65% | 0.75% | 1.23% |
Note: “↑”represents that the indicators listed continued to increase from 2010 to 2012, “↓”represents that the indicators listed continued to decrease from 2010 to 2012.
The data of 2012 shows that the USA, Germany and Japan, the first three largest export markets of China lights & lighting, accounted for 25.04%, 7.13% and 5.75% of the total export value of the same product of China separately.
Judging from the three-year market share, the import value in proportion of Australia, Malaysia, Singapore, Brazil, Indonesia and Saudi Arabia continued to rise, while that of the USA, France, Italy, Spain and Belgium continued to decline.


