2012 Chinese Injection Machines (HS: 847710) Export Situation
Chinese Injection Machines’ Export Quantity & Value from Jan. to Jun. 2012
| Month | Quantity unit | value US Dollar Million | Year on Year(±%) | |
| Quantity | value | |||
| 1 | 1,931 | 79.1 | -33.5 | 10 |
| 2 | 1,039 | 45.6 | -24.7 | 7.9 |
| 3 | 1,867 | 74.0 | 1.2 | 13.3 |
| 4 | 1,934 | 77.4 | 4.9 | 9.8 |
| 5 | 2,309 | 97.4 | 14 | 45.8 |
| 6 | 2,102 | 79.6 | -6.3 | -4.8 |
| Total | 11,182 | 453.0 | -8.6 | 13.2 |
Major Importers of Chinese Injection Machinesfrom Jan. to Jun. 2012
| No. | Countries/Regions | From Jan. to Jun. | Year on Year(±%) | ||
| Quantity unit | value US Dollar Thousand | Quantity | value | ||
| 1 | Thailand | 985 | 53,019 | 148.7 | 118.3 |
| 2 | Turkey | 647 | 35,976 | -30 | -20.4 |
| 3 | Indonesia | 750 | 32,603 | -6.4 | 13.2 |
| 4 | Brazil | 816 | 30,024 | -32.3 | -26.3 |
| 5 | Vietnam | 879 | 28,158 | 23.8 | 60.2 |
| 6 | USA | 318 | 26,322 | 84.9 | 179.4 |
| 7 | The Russian Federation | 528 | 17,760 | -4.9 | 8.6 |
| 8 | The Republic of Korea | 441 | 15,912 | 9.4 | 40.1 |
| 9 | Mexico | 240 | 15,168 | 29 | 136.3 |
| 10 | Malaysia | 547 | 13,300 | 26.3 | -19.1 |
| 11 | Japan | 301 | 12,138 | -11.5 | 11.3 |
| 12 | India | 230 | 10,935 | -5.7 | 9.2 |
| 13 | Hong Kong | 312 | 9,077 | -16.8 | -24.7 |
| 14 | Philippines | 209 | 7,810 | 2.5 | 9.3 |
| 15 | Egypt | 267 | 7,614 | 96.3 | 25.9 |
| 16 | Poland | 95 | 7,474 | 26.7 | 121.3 |
| 17 | Iran | 242 | 7,459 | -69.2 | -63.3 |
| 18 | South Africa | 94 | 7,342 | -42.7 | -7.8 |
| 19 | Taiwan | 250 | 5,903 | -46.6 | -39.2 |
| 20 | Uzbekistan | 111 | 5,582 | 56.3 | 202.6 |
Major Export Source of Chinese Injection Machinesfrom Jan. to Jun. 2012
| No. | Regions | From Jan. to Jun. | Year on Year(±%) | Share of the Total Export Value | ||
|
|
| Quantity unit | value USD Thousand | Quantity | Value |
|
| 1 | Zhejiang | 5,914 | 231,211 | -19 | -1.4 | 51.04% |
| 2 | Shanghai | 1,122 | 86,635 | 35.3 | 55.6 | 19.13% |
| 3 | Guangdong | 2,896 | 83,546 | -3.8 | 18.6 | 18.44% |
| 4 | Jiangsu | 684 | 33,249 | 8.6 | 11.2 | 7.34% |
| 5 | Fujian | 339 | 10,465 | 23.3 | 84.7 | 2.31% |
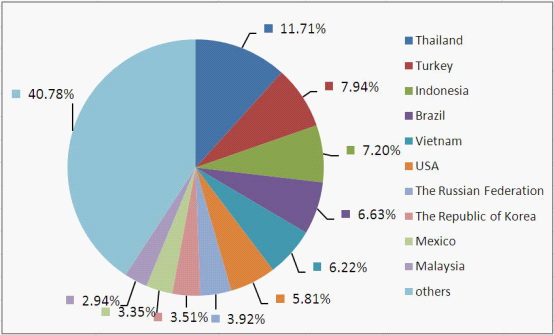
In 2012, from Jan. to Jun., Chinese Injection Machines’ Export Quantity achieved 11,200 units, declined 8.6% compared with the previous year, meanwhile, Export value amounted 453 million dollars, increased by 4.0% year-on-year.
The majorimporters were Thailand, Turkey, Indonesia, Brazil, Vietnam, the United States, Russia, South Korea, Mexico and Malaysia. Chinese Injection Machines export data for Thailand In 2012, from Jan. to Jun., shared 11.71% of the total value. Major cities/province for Chinese Injection Machineswere Zhejiang, Shanghai and Guangdong, and the total export value of Zhejiang was about 51.44% of the total export value.


