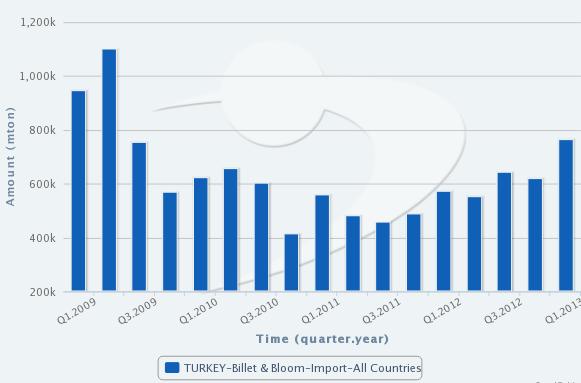
Turkey's billet imports in the first quarter of this year constituted the highest quarterly volume since the second quarter of 2009. Increasing by 23.2 percent compared to the previous quarter and up 33.2 percent compared to the same quarter of 2012, Turkey's steel bilet imports in the quarter in question amounted to 762,200 metric tons, according to the data provided by the Turkish Statistical Institute (TUIK)

The significant increase in Turkey's steel billet imports was mainly due to the decreased domestic production level amid contracting market demand. On the other hand, high scrap prices in the first quarter of the year led manufacturers to buy steel billet instead of scrap.
The Turkish Iron and Steel Producers' Association (TCUD) data show that in the first quarter of 2013 Turkey's steel billet output moved down by 5.5 percent to 6.3 million mt, while its slab output fell by seven percent to 2.2 million mt, both on year-on-year basis. The falling demand in the market caused decreased steel production as well as lower rebar exports in Turkey, while billet imports rose significantly in the first quarter.
The value of Turkey's steel billet imports in the first quarter was $429 million, increasing 17.5 percent year on year. According to the data released by TUIK, in the first quarter the average price of Turkey's steel billet imports stood at $562/mt, falling compared to the average of $638/mt recorded in the same period of 2012.
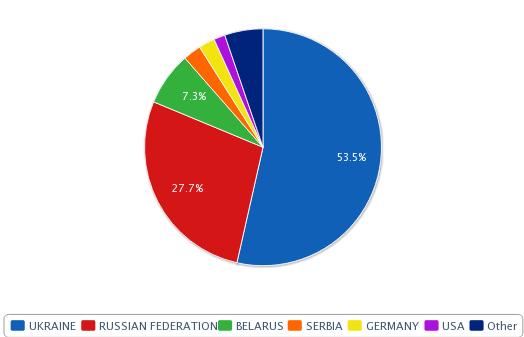
Turkey's top billet import source in the first quarter was Ukraine which supplied 408,102 mt of billet, up 49.25 percent compared to the same quarter of 2012 and up slightly compared to the previous quarter. Meanwhile, Turkey's billet imports from Russia amounted to 211,303 mt in the period in question, up slightly compared to the first quarter of the previous year but more than double compared to the previous quarter, following three quarters of decline on quarter-on-quarter basis.
Turkey's main steel billet sources on country basis in the first quarter of this year are presented in the chart below:

