China Sulphur Export Volume and Value, from Jan. to Dec. 2013
| Month | Volume (Kg) | Value (USD) | Year-on-Year | |
| Volume | Value | |||
| Jan. | 102,000 | 32,148 | -60.1% | -73.2% |
| Feb. | 93,150 | 30,060 | -56.7% | -53.8% |
| Mar. | 136,500 | 51,038 | -64.2% | -63.1% |
| Apr. | 196,002 | 67,472 | -9.5% | -20.8% |
| May | 121,000 | 41,752 | 23.5% | -0.8% |
| Jun. | 228,000 | 68,679 | 9.8% | -12.2% |
| Jul. | 298,500 | 115,097 | 292.1% | 279.4% |
| Aug. | 243,675 | 76,202 | 654.4% | 560% |
| Sept. | 226,000 | 61,104 | -8.8% | -38.8% |
| Oct. | 16,000 | 6,750 | -20% | -32.5% |
| Nov. | 70,264 | 37,014 | -55% | -43.9% |
| Dec. | 56,000 | 21,052 | -74.3% | -77.6% |
| Total | 1,787,091 | 608,368 | -15.9% | -27.6% |
The export volume of sulphur amounted to 1787.09 tons, decreased15.9% year-on-year; the export value amounted to 0.6084 million dollars, a decrease of 27.6%.
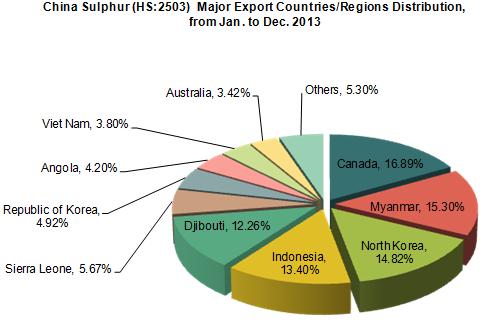
China Sulphur Major Export Countries/Regions Distribution, from Jan. to Dec. 2013
| No. | Countries | Volume (Kg) | Value (USD) | Year-on-Year | |
| Volume | Value | ||||
| 1 | Canada | 210,264 | 102,781 | -28.1% | -39.6% |
| 2 | Myanmar | 307,175 | 93,108 | 1413.2% | 475.5% |
| 3 | North Korea | 343,650 | 90,173 | -43.2% | -50.4% |
| 4 | Indonesia | 260,002 | 81,545 | -4.8% | -26.2% |
| 5 | Djibouti | 242,000 | 74,585 | 0 | 0 |
| 6 | Sierra Leone | 75,000 | 34,500 | 87.5% | 139.6% |
| 7 | Republic of Korea | 96,000 | 29,958 | 1.1% | -24.2% |
| 8 | Angola | 70,000 | 25,556 | 0 | 0 |
| 9 | Viet Nam | 74,000 | 23,133 | -66.4% | -71.4% |
| 10 | Australia | 41,000 | 20,800 | -60.2% | -59.7% |

The largest export market for Chinese sulphur was Canada. The total export value to Canada was 10.28 thousand dollars, from Jan. to Dec. 2013, with a decrease of 39.6% year on year. Among the total export value of sulphur, it accounted for 21.67%, followed by Japan, which accounted for 4.01%.
Among the top ten export countries/ regions, from Jan. to Dec. 2013, the largest increase of volume and value were both in Netherlands, with an increase of 80% in volume and 104% in value year on year.
China Sulphur Original Places of Exported Goods, from Jan. to Dec. 2013
| No. | Regions | Volume (Kg) | Value (USD) | Year-on-Year | |
| Volume | Value | ||||
| 1 | Shandong | 496,150 | 193,133 | -26.9% | -33.7% |
| 2 | Jiangsu | 355,002 | 114,870 | -13.3% | -27.6% |
| 3 | Liaoning | 383,500 | 100,310 | -39.1% | -47.2% |
| 4 | Yunnan | 291,000 | 84,898 | 0 | 0 |
| 5 | Guangxi Zhuang Autonomous Region | 91,000 | 38,710 | -35.5% | -25.1% |
| 6 | Hebei | 81,000 | 35,289 | -21.4% | -31.5% |
| 7 | Tianjin | 23,264 | 20,635 | 25.6% | 4.2% |
| 8 | Hunan | 50,000 | 12,313 | 0 | 0 |
| 9 | Shanghai | 16,175 | 8,210 | -25.3% | -78.2% |
The major sulphur original places in China are Shandong, Jiangsu, Liaoning and Yunnan. From Jan. to Dec. 2013, the export volume of the above five provinces accounted for 85.37% of the total export volume, and the export value of the five provinces accounted for 81.07% of the total export value. Among the top ten sulphur export origin places, the largest decline of export value was in Shanghai, a decrease of 78.2%; followed by Liaoning, a decrease of 47.2%.


