The Total Value Trend of Chinese Exporters in Construction Machinery Industry in 2003-2014
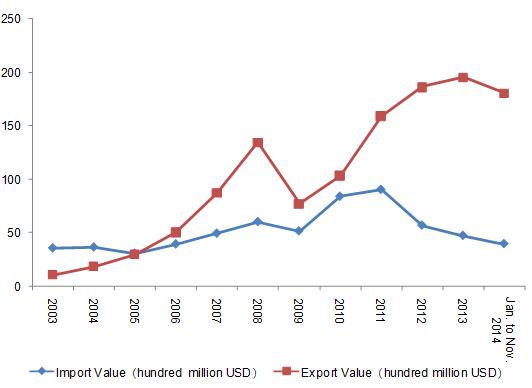
Imports Value (Hundred dollars); Exports Value (Hundred dollars)
According to statistics from the General Administration of Customs, the exports, imports value of Chinese Construction Machinery Industry is 24.077 billion dollars, decreasing by 0.78% compared to the same period of last year. The imports value is 4.285 billion dollars, decreasing by 9.5% compared to the same period of last year; while the exports value is 19.792 billion dollars, increasing by 1.3% compared to the same period of last year.
Data from: Huicong Machinery.
From Jan. to Dec. 2014, Chinese Major Machinery Exports (Rating from Exports Value Order)
| HS Code | Products Name | Unit | Volume | Value(Dollars) | Compared to the Same Period Last Year | |
| Volume | Value | |||||
| 8431 | Industrial machinery accessories | Kg | 3,112,068,009 | 8,157,645,462 | 19.5% | 13% |
| 8428 | lifting, handling, loading or unloading machinery | Set | 2,602,563 | 4,265,223,566 | 12.9% | 7.1% |
| 8429 | Bulldozers, graders etc. | Set | 86,106 | 3,917,395,877 | -17.8% | -8.6% |
| 8426 | Derricks | Set | 21,480 | 3,580,891,893 | 14.8% | -5.1% |
| 8474 | sorting of earth, stone, ores; screening, grinding, mixing machines
grinding, mixing machines grinding, mixing machines | — | 311,602,838 | 3,231,048,748 | 6.2% | -0.1% |
| 8430 | Moving of earth, stone, ores; leveling machinesmachines | Set | 1,235,302 | 3,099,169,456 | 9.9% | 0.5% |
| 8425 | Set | 52,681,177 | 1,994,650,283 | 7.4% | 14.9% | |
| 8427 | Fork-lift trucks | Set | 1,708,984 | 1,944,225,997 | -4.7% | 15.4% |
| 8705 | Special purpose motor vehicles | Set | 17,550 | 1,602,153,964 | 1.3% | -6.8% |
From Jan. to Dec. 2014, Chinese Major Block and Hoist; Hoists and Winches Exporters Distribution (Rating from Exports Value Order) (HS: 8425)
| Region | Export Value(USD) | Percentage |
| Zhejiang | 690,940,526 | 34.6% |
| Jiangsu | 484,177,540 | 24.3% |
| Shanghai | 256,505,213 | 12.9% |
| Guangdong | 107,910,438 | 5.4% |
| Shandong | 90,551,548 | 4.5% |
From the export data from Jan. to Dec. 2014, Chinese Block and hoist; Hoists and winches major original export places are Zhejiang, Jiangsu and Shanghai. Zhejiang's export value accounts for 34.6% of all.
From Jan. to Dec. 2014, Chinese Major Derricks Exporters Distribution (Rating from Exports Value Order) (HS: 8426)
| Region | Export Value(USD) | Percentage |
| Shanghai | 1,595,631,324 | 44.6% |
| Jiangsu | 758,792,241 | 21.2% |
| Liaoning | 258,261,546 | 7.2% |
| Fujian | 178,563,777 | 5.0% |
| Hunan | 156,511,383 | 4.4% |
From the export data from Jan. to Dec. 2014, Chinese Derricks major original export places are Shanghai, Jiangsu and Liaoning. Shanghai's export value accounts for 44.6% of all.
From Jan. to Dec. 2014, Chinese Major Fork-lift Trucks Exporters Distribution (Rating from Exports Value Order) (HS: 8427)
| Region | Export Value(USD) | Percentage |
| Zhejiang | 591,259,966 | 30.4% |
| Jiangsu | 387,397,086 | 19.9% |
| Anhui | 203,946,352 | 10.5% |
| Liaoning | 200,840,570 | 10.3% |
| Shandong | 142,318,302 | 7.3% |
From the export data from Jan. to Dec. 2014, Chinese Fork-lift trucks major original export places are Zhejiang, Jiangsu and Anhui. Zhejiang's export value accounts for 30.4% of all.
From Jan. to Dec. 2014, Chinese Lifting, Handling, Loading or Unloading Machinery Exporters Distribution (Rating from Exports Value Order) (HS: 8428)
| Region | Export Value(USD) | Percentage |
| Jiangsu | 1,324,282,268 | 31.0% |
| Shanghai | 634,985,890 | 14.9% |
| Zhejiang | 513,815,990 | 12.0% |
| Guangdong | 472,346,695 | 11.1% |
| Liaoning | 363,024,793 | 8.5% |
From the export data from Jan. to Dec. 2014, Chinese lifting, handling, loading or unloading machinery major original export places are Jiangsu, Shanghai and Zhejiang. Jiangsu's export value accounts for 31% of all.
From Jan. to Dec. 2014, Chinese Bulldozers, Graders etc. Exporters Distribution (Rating from Exports Value Order) (HS: 8429)
| Region | Export Value(USD) | Percentage |
| Jiangsu | 1,545,880,919 | 39.5% |
| Shandong | 837,964,281 | 21.4% |
| Shanghai | 235,353,839 | 6.0% |
| Guangxi Zhuang Autonomous Region | 205,524,646 | 5.2% |
| Beijing | 188,546,834 | 4.8% |
From the export data from Jan. to Dec. 2014, Chinese major original export places of Bulldozers, Graders etc. are Jiangsu, Shandong and Shanghai. Jiangsu's export value accounts for 39.5% of all.
From Jan. to Dec. 2014, Chinese Moving of Earth, Stone, Ores; Leveling Machines Exporters Distribution (Rating From Exports Value Order) (HS: 8430)
| Region | Export Value(USD) | Percentage |
| Sichuan | 598,540,015 | 19.3% |
| Shandong | 440,022,902 | 14.2% |
| Shanghai | 242,363,069 | 7.8% |
| Jiangsu | 229,320,400 | 7.4% |
| Beijing | 210,687,068 | 6.8% |
From the export data from Jan. to Dec. 2014, Chinese major original export places of Moving of earth, stone, ores; leveling machines are Sichuan, Shandong and Shanghai. Sichuan's export value accounts for 19.3% of all.
From Jan. to Dec. 2014, Chinese Industrial Machinery Accessories Exporters Distribution (Rating from Exports Value Order) (HS: 8431)
| Region | Export Value(USD) | Percentage |
| Jiangsu | 1,906,237,331 | 23.4% |
| Shandong | 1,028,625,466 | 12.6% |
| Zhejiang | 911,529,566 | 11.2% |
| Shanghai | 873,170,210 | 10.7% |
| Tianjin | 468,285,399 | 5.7% |
From the export data from Jan. to Dec. 2014, Chinese major original export places of Industrial machinery accessories are Jiangsu, Shandong and Zhejiang. Jiangsu's export value accounts for 23.4% of all.
From Jan. to Dec. 2014, Chinese Sorting of Earth, Stone, Ores; Screening, Grinding, Mixing Machines Exporters Distribution (Rating from Exports Value Order) (HS: 8474)
| Region | Export Value(USD) | Percentage |
| Shanghai | 492,597,054 | 15.2% |
| Jiangsu | 389,197,733 | 12.0% |
| Guangdong | 384,801,254 | 11.9% |
| Shandong | 355,816,699 | 11.0% |
| Henan | 318,862,973 | 9.9% |
From the export data from Jan. to Dec. 2014, Chinese major original export places of sorting of earth, stone, ores; screening, grinding, mixing machines are Shanghai, Jiangsu and Guangdong. Shanghai's export value accounts for 15.2% of all.
From Jan. to Dec. 2014, Chinese Special Purpose Motor Vehicles Exporters Distribution (Rating from Exports Value Order) (HS: 8705)
| Region | Export Value(USD) | Percentage |
| Hunan | 470,908,755 | 29.4% |
| Jiangsu | 256,539,917 | 16.0% |
| Shandong | 180,971,210 | 11.3% |
| Beijing | 109,261,236 | 6.8% |
| Hubei | 80,221,639 | 5.0% |
From the export data from Jan. to Dec. 2014, Chinese major original export places of Special purpose motor vehicles are Hunan, Jiangsu and Shandong. Hunan's export value accounts for 15.2% of all.
Data from: The Customs Information Network


