China Quicklime Export Volume and Value, from Jan. to Dec. 2013
| Month | Volume (Kg) | Value (USD) | Year-on-Year | |
| Volume | Value | |||
| Jan. | 8,692,196 | 1,490,550 | -53.4% | 30.2% |
| Feb. | 6,966,960 | 1,073,482 | -64.8% | -18.9% |
| Mar. | 17,748,393 | 2,263,746 | 27.6% | 95.9% |
| Apr. | 5,813,205 | 1,510,789 | -63.7% | 10.4% |
| May | 17,814,713 | 2,527,738 | 40.9% | 190.2% |
| Jun. | 9,473,897 | 1,607,603 | -56.3% | -4.8% |
| Jul. | 9,490,912 | 1,413,590 | -20.9% | -12.6% |
| Aug. | 15,449,803 | 2,143,228 | 48.8% | 105.2% |
| Sept. | 15,947,374 | 2,646,229 | 27.6% | 136.6% |
| Oct. | 11,818,109 | 1,366,659 | 30.9% | 54.8% |
| Nov. | 9,334,456 | 1,541,545 | -20.9% | 22.1% |
| Dec. | 15,202,883 | 2,490,359 | -0.7% | 38.4% |
| Total | 143,752,901 | 22,075,518 | -17.3% | 44.5% |
The export volume of Chinese quicklime was 14.38 thousand tons, from Jan. to Dec. 2013, declined 17.3% year on year; the export value was 1.4906 million dollars, increased 44.5% year on year.
China Quicklime Major Export Countries/Regions Distribution, from Jan. to Dec. 2013
| No. | Countries | Volume (Kg) | Value (USD) | Year-on-Year | ||
| Volume | Value | |||||
| 1 | Hong Kong | 39,007,653 | 5,838,711 | -19.3% | 254.1% | |
| 2 | Mongolia | 26,103,541 | 2,708,081 | 104.9% | 210.4% | |
| 3 | Republic of Korea | 24,891,362 | 2,162,130 | -51.5% | -50.1% | |
| 4 | Macao | 5,027,370 | 2,050,013 | -38.5% | 75.9% | |
| 5 | Australia | 18,347,879 | 1,743,148 | 289.8% | 258.1% | |
| 6 | Kyrgyzstan | 2,274,258 | 1,217,741 | 67.5% | 1692.9% | |
| 7 | Nigeria | 1,939,866 | 1,096,582 | 8% | -12.2% | |
| 8 | Viet Nam | 2,469,025 | 532,716 | 1.1% | 105.8% | |
| 9 | Russian Federation | 5,189,144 | 502,677 | -14.2% | -56.9% | |
| 10 | USA | 1,126,826 | 398,343 | 628% | 251.2% | |
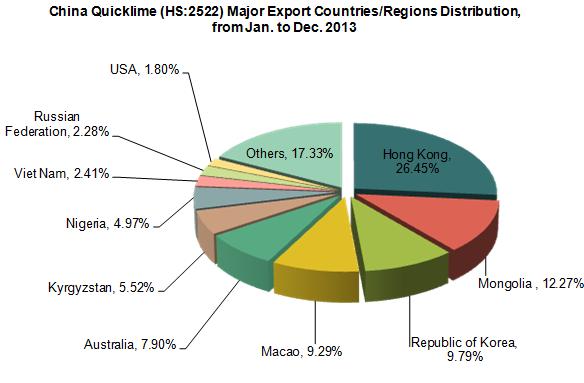
The largest export market for Chinese quicklime was Hong Kong. The total export value to Hong Kong was 5.8387 million dollars, from Jan. to Dec. 2013, with an increase of 254.1% year on year. Among the total export value of quicklime, it accounted for 26.45%, followed by Mongolia, which accounted for 12.27%.
Among the top ten export countries/ regions, from Jan. to Dec. 2013, the largest increase of volume was in Australia, increased 289.8% year on year; and the largest increase in value was in Kyrgyzstan, increased 1692.9% year on year.
China Quicklime Original Places of Exported Goods, from Jan. to Dec. 2013
| No. | Regions | Volume (Kg) | Value (USD) | Year-on-Year | ||
| Volume | Value | |||||
| 1 | Guangdong | 32,139,036 | 7,075,034 | -25.4% | 283.3% | |
| 2 | Shandong | 26,960,330 | 2,791,217 | 36.3% | -1.3% | |
| 3 | Inner Mongolia Autonomous Region | 25,797,206 | 2,586,531 | 113.6% | 215.4% | |
| 4 | Anhui | 25,029,340 | 2,088,561 | -51.3% | -51.4% | |
| 5 | Jiangsu | 2,347,252 | 1,568,084 | 4% | 20.9% | |
| 6 | Zhejiang | 6,639,303 | 1,553,988 | 12.1% | 28.9% | |
| 7 | Xinjiang Uygur Autonomous Region | 2,381,067 | 1,225,383 | 18.4% | 576.4% | |
| 8 | Hebei | 6,021,145 | 844,751 | 399.3% | 295.1% | |
| 9 | Sichuan | 1,277,880 | 725,996 | 172.7% | 455.3% | |
| 10 | Guangxi Zhuang Autonomous Region | 9,401,005 | 249,568 | -19.7% | -25.6% | |
The major quicklime original places in China are Guangdong, Shandong, Inner Mongolia Autonomous Region and Anhui. From Jan. to Dec. 2013, the export volume of the above four places accounted for 76.47% of the total export volume, and the export value of the four provinces accounted for 65.87% of the total export value. Among the top ten quicklime export origin places, the largest increase of export volume was in Hebei, increased 399.3%; and the largest increase of export value was in Sichuan, increased 455.3%.


 2 Bulk Lime White Powder")
 2 Industrial Grade")