China Natural Graphite Export Volume and Value, from Jan. to Dec. 2013
| Month | Volume (Kg) | Value (USD) | Year-on-Year | |
| Volume | Value | |||
| Jan. | 26,684,280 | 24,463,958 | -9.8% | -15% |
| Feb. | 13,817,422 | 17,817,226 | -26.1% | -11.8% |
| Mar. | 15,447,712 | 20,305,906 | -28% | -7% |
| Apr. | 21,291,391 | 21,157,632 | 18.2% | -11.4% |
| May | 26,847,624 | 25,320,870 | 62% | 5% |
| Jun. | 19,486,809 | 22,274,175 | -6.8% | -14.3% |
| Jul. | 20,684,159 | 24,197,697 | -1.9% | -13.2% |
| Aug. | 27,380,674 | 26,715,022 | 33.7% | 23.7% |
| Sept. | 18,743,724 | 24,834,891 | -25.1% | -7.4% |
| Oct. | 21,559,319 | 25,971,090 | 16.9% | 46.6% |
| Nov. | 20,360,897 | 22,161,753 | -28.5% | -19.9% |
| Dec. | 20,811,777 | 21,513,717 | 8.9% | 2.1% |
| Total | 253,115,788 | 276,733,937 | -1.8% | -3.8% |
The export volume of Chinese natural graphite was 25.31 thousand tons, from Jan. to Dec. 2013, declined 1.8% year on year; the export value was 0.277 billion dollars, declined 3.8% year on year.
China Natural Graphite Major Export Countries/Regions Distribution, from Jan. to Dec. 2013
| No. | Countries | Volume (Kg) | Value (USD) | Year-on-Year | ||
| Volume | Value | |||||
| 1 | Republic of Korea | 26,183,050 | 88,797,474 | -7.8% | -5.5% | |
| 2 | Japan | 81,402,612 | 86,130,313 | -7.6% | -7.4% | |
| 3 | USA | 20,811,049 | 19,798,584 | 24.1% | 8.4% | |
| 4 | Germany | 11,459,407 | 11,873,827 | 29.1% | 11% | |
| 5 | India | 17,648,736 | 11,425,550 | 13.8% | -11.7% | |
| 6 | Netherlands | 19,972,100 | 9,327,362 | -6.7% | -24.7% | |
| 7 | Turkey | 8,317,799 | 7,101,284 | 56.8% | 19.5% | |
| 8 | Malaysia | 1,076,890 | 6,756,980 | 16% | 919% | |
| 9 | Iran | 5,918,310 | 5,808,697 | 89.6% | 64.4% | |
| 10 | Poland | 2,502,000 | 3,466,563 | -34.4% | -28.8% | |
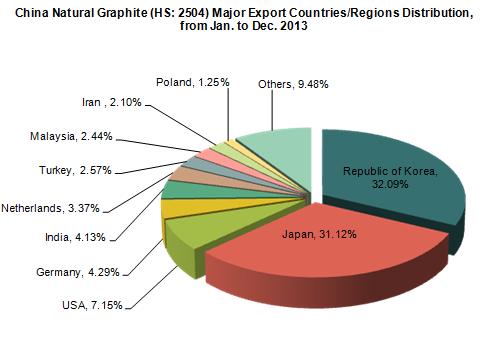
The largest export market for Chinese natural graphite was Korea. The total export value to Korea was 88.7975 million dollars, from Jan. to Dec. 2013, with a decrease of 5.5% year on year. Among the total export value of natural graphite, it accounted for 32.09%, followed by Japan, which accounted for 31.12%.
Among the top ten export countries/ regions, from Jan. to Dec. 2013, the largest increase of value was in Malaysia, an increase of 919% year on year; while, only increased 16% in export volume.
China Natural Graphite Original Places of Exported Goods, from Jan. to Dec. 2013
| No. | Regions | Volume (Kg) | Value (USD) | Year-on-Year | ||
| Volume | Value | |||||
| 1 | Shandong | 62,863,886 | 99,622,864 | 2.7% | -11.4% | |
| 2 | Guangdong | 9,235,646 | 78,357,838 | 1.3% | 17% | |
| 3 | Heilongjiang | 60,217,487 | 38,078,505 | 32.3% | 9.3% | |
| 4 | Hunan | 60,438,343 | 29,819,195 | -4.6% | -8.8% | |
| 5 | Henan | 5,223,954 | 9,872,756 | -1.4% | -10.5% | |
| 6 | Liaoning | 34,167,399 | 5,360,108 | -24.4% | -45.4% | |
| 7 | Inner Mongolia Autonomous Region | 6,835,200 | 5,340,399 | -29.4% | -8.6% | |
| 8 | Shanxi | 2,658,003 | 2,500,423 | 38.2% | 90.1% | |
| 9 | Shanghai | 4,453,923 | 2,335,317 | -45% | -44.8% | |
| 10 | Jiangsu | 1,238,996 | 1,318,114 | 76.4% | 98.4% | |
The major natural graphite original places in China are Shandong, Guangdong, Heilongjiang and Hunan. From Jan. to Dec. 2013, the export volume of the above four provinces accounted for 76.15% of the total export volume, and the export value of the four provinces accounted for 88.85% of the total export value. Among the top ten natural graphite export origin places, the largest increase of export volume and value were both in Jiangsu, increased 76.4% in volume and increased 98.4% in value.


