1. Knitting Machinery (HS: 8447) Annual Export Trends
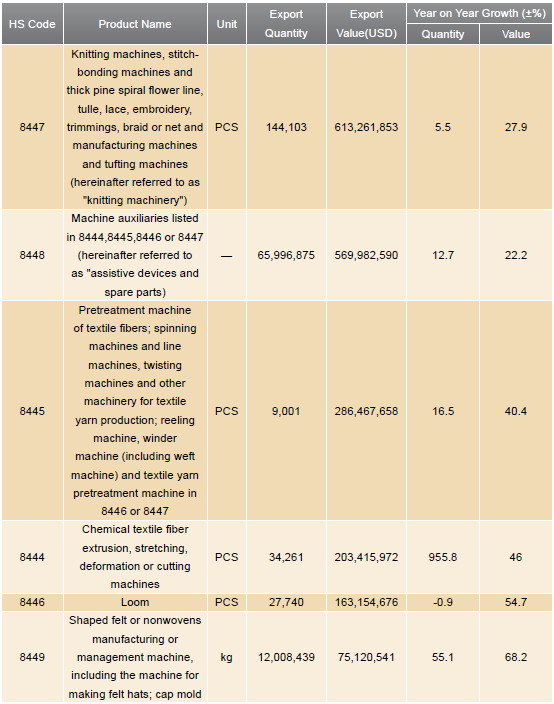
China's Major Textile Machinery Exports
According to customs statistics, from January to December 2011, China's textile machinery exports were 2.245 billion dollars, achieving a year-on-year growth of 27.81%.
In 2011, China's knitting machinery exports amounted to $ 613 million, getting a year-on-year growth of 27.81%, which accounted for 27.31% and ranked first in all textile machinery, followed by assistive devices and spare parts, printing and dyeing machinery, spinning machinery, chemical fiber machinery, Loom, non-woven fabric machinery and weaving preparation machinery. Loom, non-woven fabric machinery and weaving preparation machinery exports rose by over 50%, while growth in auxiliary equipment and spare parts, printing and dyeing machinery was lower than the overall increase (27.81%).
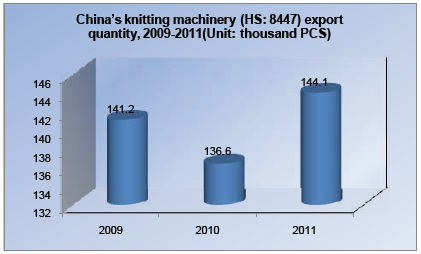
1.1. China's Knitting Machinery (HS: 8447) Export Quantity Trend.
1.2. China's Knitting Machinery (HS: 8447) Export Value Trend.
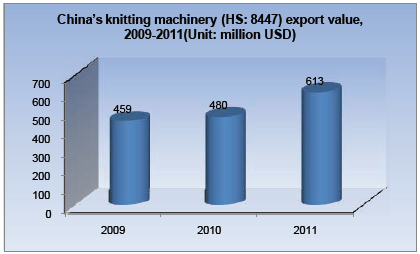
2009-2011, China's total export quantity of knitting machinery shaped a "V" and export amount increased year by year. In 2011, the total export quantity was about 144.1 thousand units, up 5.5% over the previous year and export value totaled about $ 613 million, an increase of 27.9%.
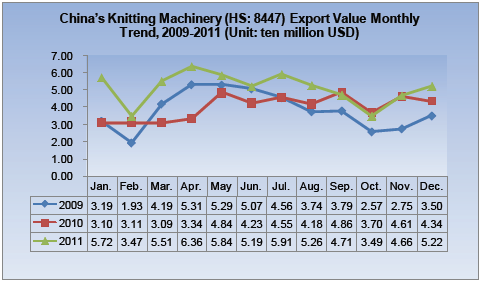
1.3. China's Knitting Machinery (HS: 8447) Export Value Monthly Trend.
China's Knitting Machinery (HS: 8447) Export Value Monthly Trend(Unit: ten million USD)
1.4. Main Importers for China's Knitting Machinery (HS: 8447) 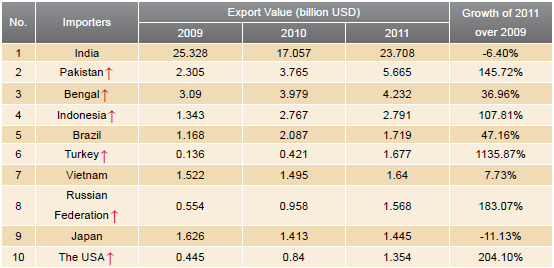
Note:↑ indicates continuous growth of export value from 2009 to 2011
2009-2011, China's knitting machinery exports to Turkey grew fastest. In 2009, China's total exports of knitting machinery to Turkey amounted approximately $ 136 million, and the number in 2011 was $ 1.677 billion, increasing by 1135.87% over 2009.
1.5. Market Share of Main Importers for China's knitting machinery (HS: 8447)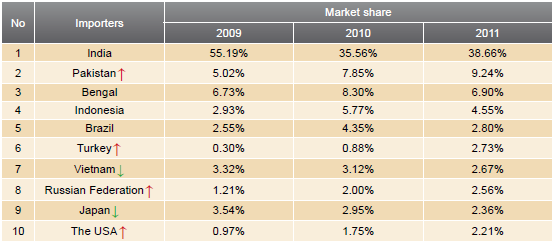
Note:"↑"indicates continuous increase of market share the country takes in China's total export value, and"↓"indicates continuous decrease of market share that country takes in China's total export value.
In 2011, China's total export value to top ten knitting machinery market accounted for 74.68% of China's total exports. The top three countries / regions are India, Pakistan and Bangladesh, accounting for 38.66%, 9.24% and 6.90% respectively. In terms of the market share changes from 2009 to 2011, China's exports to Vietnam and Japan declined year by year, while exports to Pakistan, Turkey, the Russian Federation and the USA got continuous increase. Market share of China's knitting machinery exports to India also increased in 2011 compared with 2010.
2. Annual Import and Export Trends of Global Knitting Machinery (HS: 8447)
2.1. Annual Import and Export Trends of Global Knitting Machinery (HS: 8447)
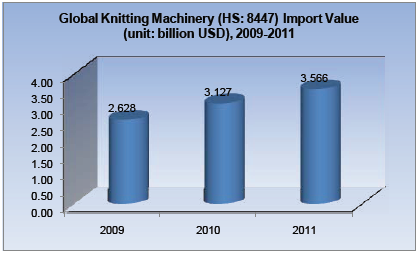
Total import value of global knitting machinery grew year by year from 2009 to 2011, of which, in 2011 imports amounted to approximately $ 3.566 billion, achieving an increase of 14.06%.
2.2. Import Value of Main Countries/ Regions Demand for Knitting Machinery (HS: 8447)
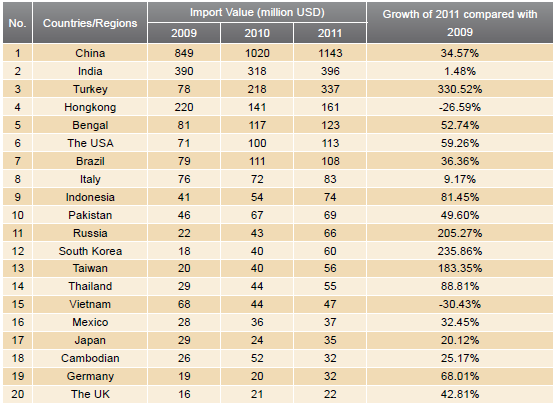
As the world's largest importing country for knitting machinery, China's imports value of knitting machinery was about $ 1.143 billion in 2011, an increase of 12.12% compared with 2010. India and Turkey were the second and the third, whose imports grew by 24.46% and 54.78% respectively in 2011. In the three years, among all of the world's top 20 knitting machinery importing countries, Turkey and South Korea got largest import value increase, which were 330.52% and 235.86% in 2011 compared to 2009.
2.3. Market Share of Main Countries/ Regions Demand for Knitting Machinery (HS: 8447)
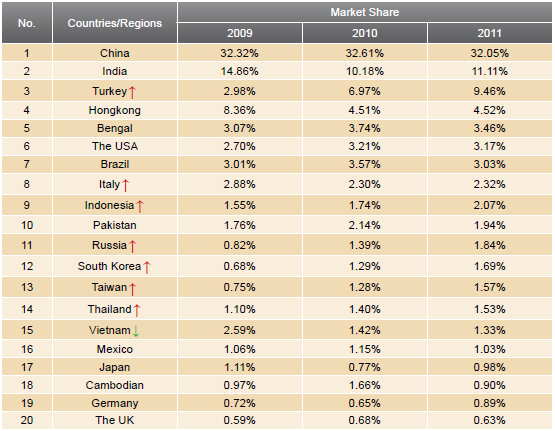
Note: "↑"indicates continuous increase of market share the country's import value takes in global total, and" ↓"indicates continuous decrease of market share the country's import value takes in global total.
Seen from the import value's market share, Turkey, Italy, Indonesia, Russia, South Korea, Taiwan and Thailand got continuous increase from 2009 to 2011, while Vietnam declined year by year.
2.4. Export Value of Main Countries / Regions Demand for Global Knitting Machinery (HS: 8447)
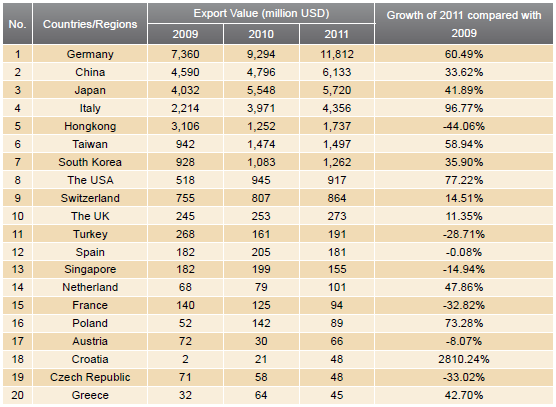
Germany is the world's largest exporter of knitting machinery. In 2011, German knitting machinery exports accounted for 32.65% of the world's total. 2009-2011, among the world's top 20 largest knitting machinery export supply countries, Croatia grew by 2810.24% in 2011 compared to 2009 and ranked first.
2.5. Market Share of Main Export Countries/Regions of Global Knitting Machinery (HS: 8447)
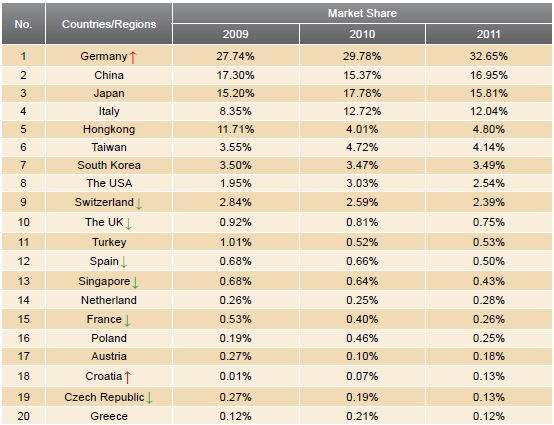
Note: "↑"indicates continuous increase of market share the country's export value takes in global total, and" ↓"indicates continuous decrease of market share the country's export value takes in global total.
Seen from the export value's market share, Germany and Croatia got continuous increase from 2009 to 2011, while Switzerland, the UK, Spain, Singapore, France and the Czech Republic declined year by year.
3. China's Knitting Machinery (HS: 8447) Exports in 2012
China's Knitting Machinery Exports from Jan. to May, 2012
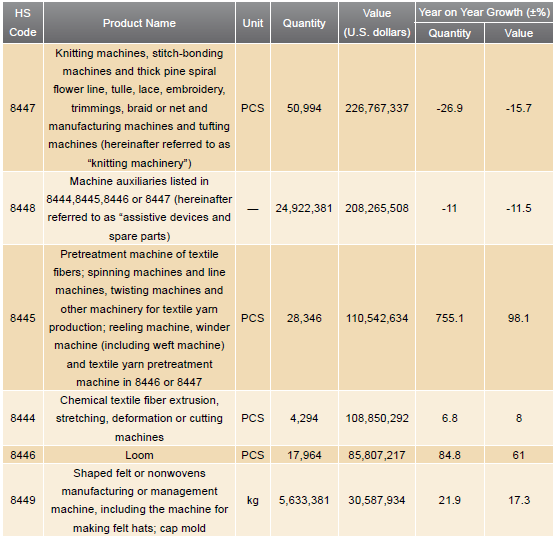
According to customs statistics, the accumulative export value of China's knitting machinery was $ 227 million in the first five months of 2012, down 15.7%, ranking first, followed by the auxiliary device and spare parts, with exports of about $ 208 million, down 11.5%. The third was chemical textile fiber extrusion, drawing, texturing or cutting machine, whose export volume grew by 755.1% and export value increased by 98.1% over the previous year.
3.1. China's Knitting Machinery (HS: 8447) Export Quantity and Value from Jan. to May, 2012

3.2. China's Knitting Machinery (HS: 8447) Exports (by Countries / Regions) from Jan. to May, 2012
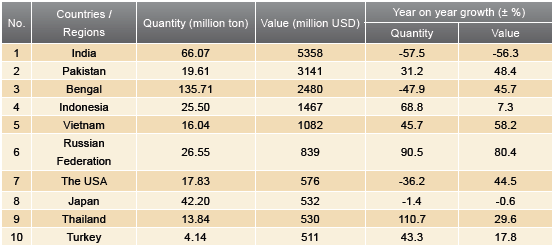
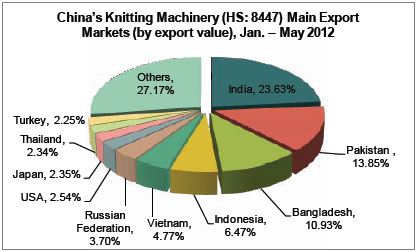
From Jan. to May 2012, in the view of export quantity, six in the top ten export destination countries / regions increased while the other four got negative growth. Seen from the year-on-year growth, countries achieved large increase were Thailand (up 110.7%), Russian Federation (up 90.5 percent) and Indonesia (up 68.8%), while India (down 57.5%) and Bangladesh country (down 47.9%) decreased largely. It is notable that Thailand had replaced Brazil to be one of the China's knitting machinery top ten destination countries / regions.
3.3. China's Main Export Catchments of Knitting Machinery(HS: 8447), Jan.-May 2012
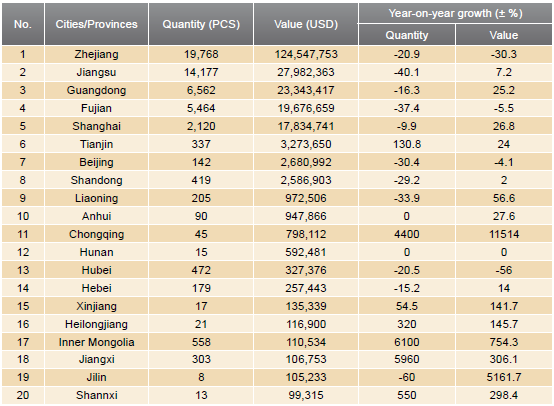
Zhejiang, Jiangsu, Guangdong, Fujian and Shanghai are the top five export catchments of China's the knitting machinery. From Jan. to May 2012, total knitting machinery exports of the above provinces and cities accounted for 94.1% of China's total. However, all their export volume decreased to different extent, in which Jiangsu decreased most, by 40.1%.
4. Imports of Main Countries Demand for Knitting Machinery (HS: 8447)
4.1. India's Knitting Machinery (HS: 8447) Import
India's Knitting Machinery (HS: 8447) Imports Trend
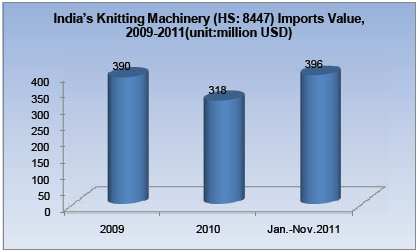
2009-2011, India knitting machinery imports trends shaped a "V". The total import value of 2011 was about $ 396 million, getting a 24.46% year-on-year growth.
Note: The above figures were projections based on the import and export between the national data.
Monthly Trend of India's Knitting Machinery Import Value
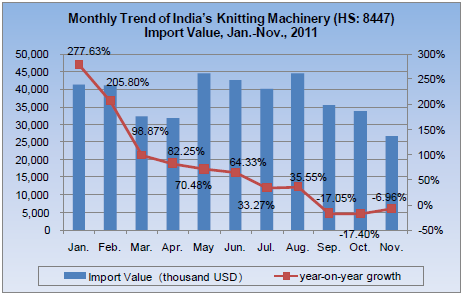
In the first eight months of 2011, India's knitting machinery imports year-on-year growth was all positive, and then in September, the figure became negative.
Main Supply Countries/Regions for India's Knitting Machinery Import
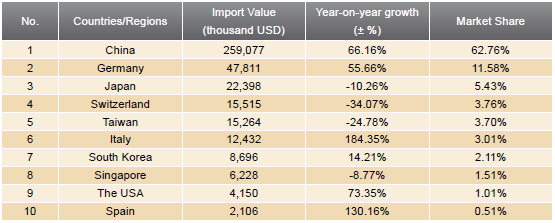
China is the largest supply country for India's knitting machinery imports, accounting for 62.76% of Indian total imports. Indian knitting machinery imports from China in 2011 increased by 66.16%, about 41.7% higher than Indian imports of other kind of such products (24.46%).
4.2. Turkey's Knitting Machinery (HS: 8447) Imports
Turkey's Knitting Machinery Imports Trend
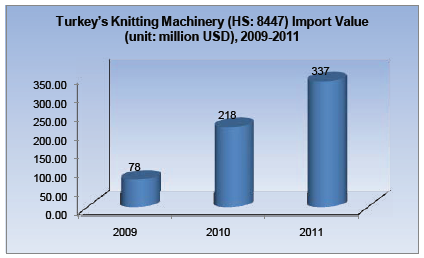
Turkey knitting machinery imports rose year by year from 2009 to 2011.In 2011, the total imports was about $ 337 million, obtaining a year-on-year growth of 54.78%.
Monthly Trend of Turkey's Knitting Machinery Import Value
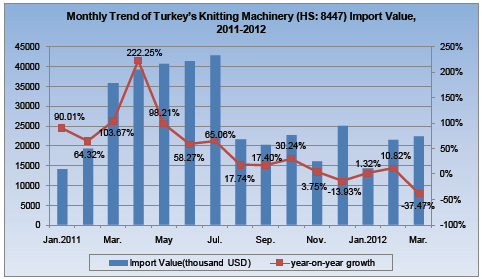
From Jan. 2011 to Mar.2012, 13 months got positive growth over the previous year and 2 months got negative.
Main Supply Countries/Regions for Turkey's Knitting Machinery Imports
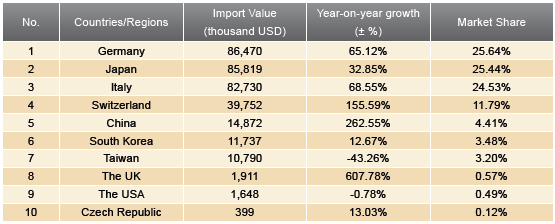
Germany was the top one supply country for Turkey's knitting machinery imports, accounting for 25.64% of the total, and China ranked fifth, accounting for 4.41% of the market share. Turkey's knitting machinery imports from China in 2011 increased by 262.55%, 207.77% higher than the growth of Turkey's total imports of such products (54.78%).
4.3. Italy's Knitting Machinery (HS: 8447) Imports
Italy's Knitting Machinery Imports Trend
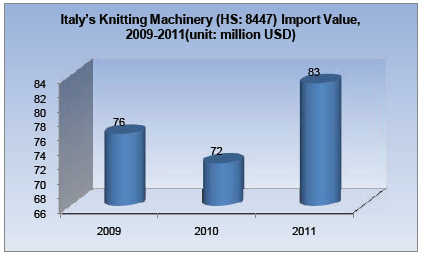
In 2009-2011, the Italy knitting machinery imports trend showed a "V" shape. In 2011, the total import amount was about $ 83 million, an increase of 15.08%.
Monthly Trend of Italy's Knitting Machinery Import Value
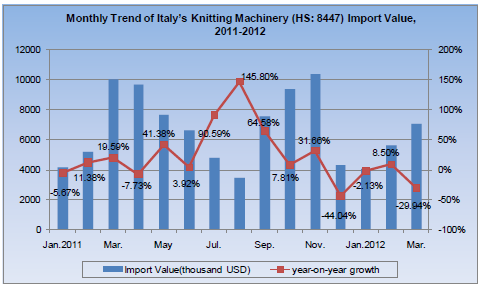
From Jan. 2011 to Mar.2012, ten months' knitting machinery imports increased while the other five months' decreased.
Main Supply Countries/Regions for Italy 's Knitting Machinery (HS: 8447)Imports
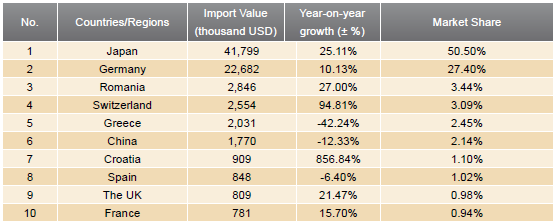
As the largest supply country for Italy knitting machinery imports, Japan accounted for 50.50% of Italian total imports, and China ranked sixth, accounting for 2.14% of the market share. Italy knitting machinery imports from China in 2011 decreased by 12.33%, 27.41% lower than overall growth of total imports of such products in Italy (15.08%).
4.4. Indonesia's Knitting Machinery (HS: 8447) Imports
Indonesia's Knitting Machinery Import Value Trend
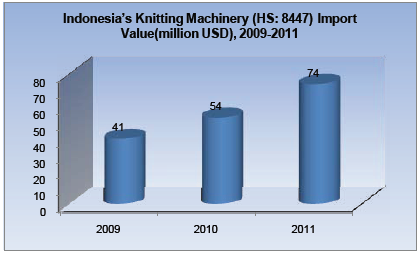
2009-2011, Indonesia knitting machinery imports increased year by year, achieving an increase of 34.00% in 2010 and 35.41% in 2011.
Monthly Trend of Indonesia's Knitting Machinery Import Value
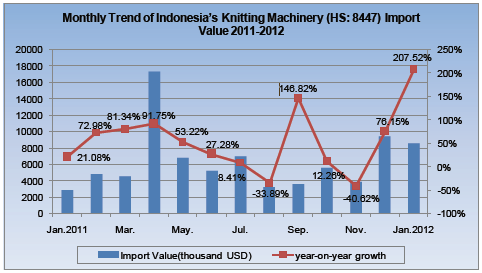
From Jan.2011 to Jan.2012, there were 11 months getting positive year-on-year growth and two getting negative (August and November in 2011).
Main Supply Countries/Regions for Indonesia's Knitting Machinery Imports
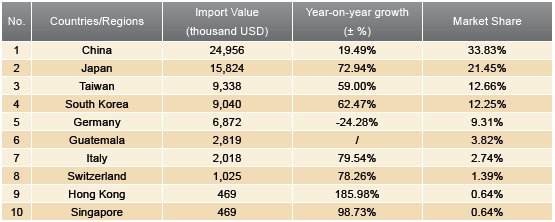
Supply countries for Indonesia's knitting machinery imports were concentrated. In 2011, imports from the top supply countries took an account of 89.50% in its total knitting machinery imports. China is its top supply country with an absolute advantage, accounting for 33.83% of the total imports, followed by Japan and Taiwan, accounting for 21.45% and 12.66% respectively.
4.5. Germany's Knitting Machinery (HS: 8447) Imports
Germany's Knitting Machinery Import Value Trend
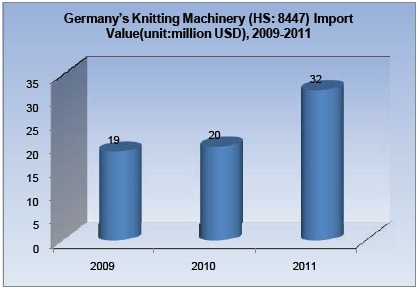
Germany's knitting machinery imports increased year by year from 2009 to 2011, growing by 8.20% in 2010 and 55.28% in 2011.
Monthly Trend of Germany's Knitting Machinery Import Value
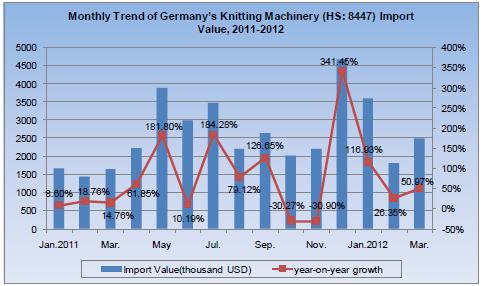
From Jan.2011 to Mar.2012, there were 13 months getting positive year-on-year growth and two getting negative (October and November in 2011).
As can be seen from the figure above, in the first nine months of 2011, year-on-year growth maintained positive, and then in October and November of 2011, the figure decreased significantly. Time went to 2012, and imports year-on-year growth kept positive for three months.
Main Supply Countries/Regions for Germany's Knitting Machinery Imports
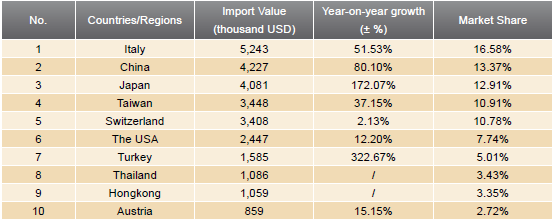
Italy was the largest supply country for Germany's knitting machinery imports, accounting for 16.58% of the total imports, followed by China, which accounts for 13.37% of the market share. In 2011, Germany's knitting machinery imports from China increased by 80.10%, about 24.82% higher than the overall growth of German imports of such products (55.28%).


