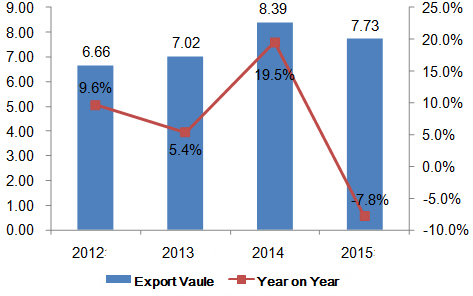
Annual Export Trends of China's Hand-operates Spanners from 2012 to 2015

China's hand-operated spanners export trended up during the period from 2012 to 2015. The export value in 2015 was USD 773,000,000, growing 16% on 2012.
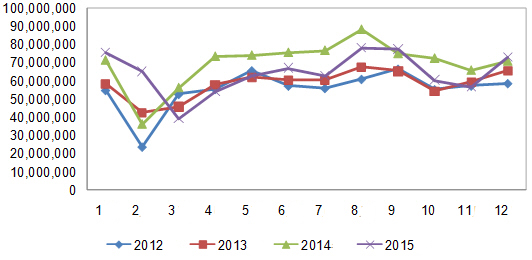
Monthly Export Trends of China's Hand-operates Spanners

According to the chart above, from 2012 to 2015, China's hand-operated spanners export surged in the third quarter. In 2015, exports peak was in August and trough was in March.
China's Hand-operates Spanners Export Volume & Value in 2015
| Month | Volume(kg) | Value(USD) | on Year | |
| Volume | Value | |||
| Jan. | 15,603,336 | 75,578,327 | -1.70% | 5.60% |
| Feb. | 13,534,770 | 65,149,363 | 107.10% | 79.20% |
| Mar. | 7,271,058 | 39,355,838 | -33.20% | -30.20% |
| Apr. | 11,979,927 | 54,263,616 | -20.20% | -26.40% |
| May. | 13,651,533 | 62,777,302 | -14.40% | -15.50% |
| Jun. | 14,308,212 | 67,167,580 | -6.90% | -11.50% |
| Jul. | 12,757,775 | 62,813,854 | -20.40% | -18.40% |
| Aug. | 15,016,398 | 78,151,477 | -6.50% | -11.70% |
| Sep. | 14,750,984 | 77,475,335 | -0.20% | 3.40% |
| Oct | 12,476,029 | 60,485,261 | -13.10% | -16.70% |
| Nov. | 12,211,958 | 56,607,445 | -15.50% | -14.30% |
| Dec. | 15,185,663 | 73,073,375 | 7.80% | 2.90% |
| Total | 158,747,643 | 772,898,773 | -6.30% | -7.80% |
China's hand-operated spanners export value reached USD 772,898,773 in 2015, falling 7.8% on year.
Top Destinations for China's Hand-operates Spanners
| No. | Country | Volume(kg) | Value(USD) | on Year | |
| Volume | Value | ||||
| 1 | United States | 41,081,343 | 232,320,070 | -1.60% | -2.70% |
| 2 | Canada | 5,359,901 | 26,008,108 | 8.20% | 2% |
| 3 | Vietnam | 4,122,557 | 25,026,733 | -50.30% | -72.50% |
| 4 | Germany | 4,518,531 | 20,611,133 | -3.70% | 1.60% |
| 5 | Japan | 3,434,281 | 20,366,793 | -9.30% | -5.60% |
| 6 | United Kingdom | 3,860,971 | 20,283,715 | 5.10% | 1.20% |
| 7 | France | 2,930,659 | 20,095,881 | 2.20% | 2.20% |
| 8 | United Arab Emirates | 3,695,636 | 16,242,554 | -15.80% | -4.40% |
| 9 | Indonesia | 4,823,926 | 15,941,944 | -32.40% | -31.90% |
| 10 | Mexico | 4,211,994 | 15,810,731 | 15.30% | 16.60% |
| 11 | Taiwan | 3,372,058 | 15,495,779 | -28.40% | -47% |
| 12 | Russian Federation | 4,127,122 | 15,371,972 | -34.50% | -38.10% |
| 13 | Brazil | 3,461,325 | 15,157,644 | -13.60% | -11.90% |
| 14 | Netherland | 3,055,106 | 15,039,127 | 5.10% | 7.60% |
| 15 | Korea | 2,745,818 | 13,577,176 | 7.10% | 14.90% |
| 16 | Poland | 3,550,978 | 13,433,294 | -5.20% | -7.40% |
| 17 | Australia | 2,180,973 | 13,074,441 | -2.90% | -4.50% |
| 18 | Iraq | 2,783,477 | 12,852,431 | 15.90% | 90.30% |
| 19 | Thailand | 2,601,499 | 12,186,383 | 13% | 23.30% |
| 20 | Pakistan | 3,172,695 | 12,073,846 | 16.90% | 51.50% |
From January to December in 2015, the top export destinations of China's hand-operated spanners were the United States, Canada and the Vietnam. In 2015, China exports to Iraq grew faster than exports to other markets and the growth was 90.3% on year.
Export Origins of China's Hand-operates Spanners
| No. | District | Volume(kg) | Value(USD) | on Year | |
| Volume | Value | ||||
| 1 | Zhejiang | 75,754,460 | 333,791,755 | -1.70% | 11% |
| 2 | Shandong | 31,389,002 | 154,099,831 | -4.10% | -4.10% |
| 3 | Shanghai | 22,580,974 | 132,245,729 | -6.80% | -9.80% |
| 4 | Jiangsu | 14,954,650 | 66,478,251 | -10.10% | -13.10% |
| 5 | Guangdong | 6,546,614 | 48,664,918 | -33.60% | -55.40% |
| 6 | Hebei | 887,253 | 5,043,543 | -7.50% | 1.20% |
| 7 | Hunan | 1,602,846 | 4,836,001 | -20.60% | -27.40% |
| 8 | Tianjin | 393,739 | 4,520,367 | -3.10% | 0.80% |
| 9 | Fujian | 779,243 | 3,411,962 | -13.50% | -11.50% |
| 10 | Anhui | 661,179 | 3,362,398 | 45.30% | 119.40% |
| 11 | Xinjiang | 436,242 | 2,917,932 | -39.10% | -41.10% |
| 12 | Chongqing | 570,719 | 2,687,742 | -3.80% | -15.60% |
| 13 | Sichuan | 628,635 | 2,227,082 | 1.20% | 0.50% |
| 14 | Henan | 400,393 | 1,298,324 | 12.30% | -5.60% |
| 15 | Jilin | 256,473 | 1,185,743 | -8.40% | -35.60% |
| 16 | Beijing | 136,930 | 1,135,765 | 14.50% | 35.40% |
| 17 | Heilongjiang | 97,551 | 1,012,120 | -56.50% | -51.60% |
| 18 | Liaoning | 129,573 | 901,694 | -35.20% | -38.40% |
| 19 | Jiangxi | 161,216 | 810,686 | -11.80% | 1.40% |
| 20 | Hubei | 123,480 | 555,344 | -42.20% | -36.30% |
The top origins of China's hand-operated spanners were Zhejiang province, Shandong province and Shanghai city in 2015. Zhejiang province exported USD 333,791,755 hand-operated spanners, making the largest export origins in China. Tianjin owned the highest export price (USD 11.48 / kg) and Hunan owned the lowest (USD 2.88 / kg).


