China Computer Export Volume Annual Trend from 2012 to 2014
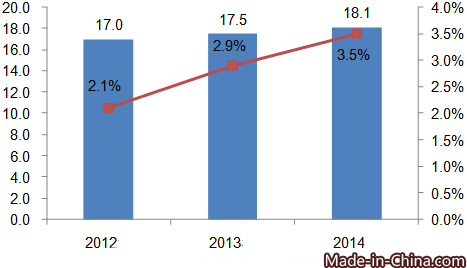
During this time, China computer export volume had a tendency to increase and the export volume in 2012 was 1.7 billion, up 2.1% by year, 1.75 billion (2013), up 2.9% and 1.81 billion (2014), up 3.5%.
China Computer Export Value Annual Trend from 2012 to 2014
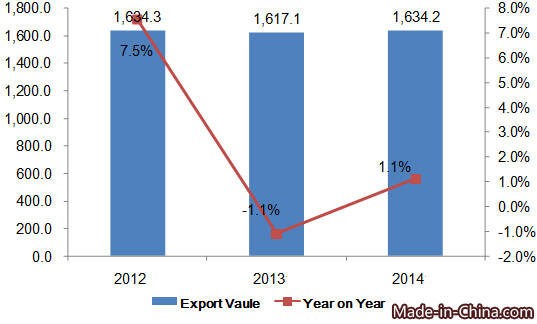
During this period, the China computer export value was USD 163.43 billion in 2012, USD 161.71 billion in 2013 and USD 163.42 in 2014.
China Computer Export Average Unit Price Annual Trend from 2012 to 2014
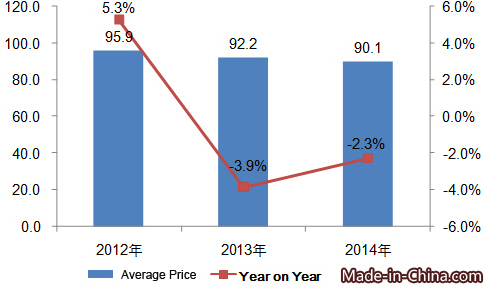
In 2014, China computer export average unit price was 90.1 dollars each, down 2.3% by year.
Export Market Trend for China Computer from 2012 to 2014
| No. | Country/Region | Export Value(USD) | Growth in 2014 than 2012 | ||
| 2012 | 2013 | 2014 | |||
| 1 | America | 50,321,544 | 49,693,691 | 49,405,989 | -1.80% |
| 2 | Hong Kong | 31,529,752 | 30,822,490 | 30,032,870 | -4.70% |
| 3 | Netherlands | 13,874,051 | 15,018,255 | 15,571,045 | 12.20% |
| 4 | Japan | 9,457,872 | 9,444,426 | 9,642,971 | 2.00% |
| 5 | Germany | 9,116,155 | 7,807,493 | 8,707,595 | -4.50% |
| 6 | England | 4,333,032 | 4,658,348 | 5,116,341 | 18.10% |
| 7 | Singapore | 3,654,616 | 3,720,037 | 3,942,260 | 7.90% |
| 8 | UAE | 2,976,425 | 2,748,451 | 3,365,479 | 13.10% |
| 9 | Australia | 3,053,434 | 3,209,605 | 3,328,309 | 9.00% |
| 10 | Korea | 3,144,934 | 3,356,619 | 3,063,192 | -2.60% |
In 2014, America is the largest export market for China computer, followed by Hong Kong and Netherlands. The export value China export to these three countries accounted for 30.2%, 18.4% and 9.5% of China’s total computer export value respectively, while the sum accounted for about 60%. America, Hong Kong and Netherlands are also the major markets for global computer export.
China Computer Export Market Share Trend from 2012 to 2014
| No. | Country/Region | Percentage of Export Value | ||
| 2012 | 2013 | 2014 | ||
| 1 | America | 30.80% | 30.70% | 30.20% |
| 2 | Hong Kong | 19.30% | 19.10% | 18.40% |
| 3 | Netherlands | 8.50% | 9.30% | 9.50% |
| 4 | Japan | 5.80% | 5.80% | 5.90% |
| 5 | Germany | 5.60% | 4.80% | 5.30% |
| 6 | England | 2.70% | 2.90% | 3.10% |
| 7 | Singapore | 2.20% | 2.30% | 2.40% |
| 8 | UAE | 1.80% | 1.70% | 2.10% |
| 9 | Australia | 1.90% | 2.00% | 2.00% |
| 10 | Korea | 1.90% | 2.10% | 1.90% |
Concerning the market share, from 2012 to 2014, the proportion of export value to Netherlands, Japan, England, Singapore and Australia continues increasing, while to America and Hong Kong decreases year by year.


