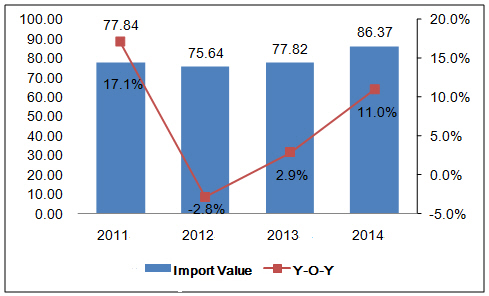
Global Headgear & Parts Import Trend from 2011 to 2014

Global headgear & parts imports showed a V-shaped growth in the four years and the import value was USD 7784 million, 7564 million, 7782 million and 8637 million. 2014’s import value increased 11.0% by year, up 11.0% than 2011’s.
Global headgear & parts import countries from Jan. to Jun. in 2015
| No. | Import Country | Import Value(Thousand USD) | Y-O-Y |
| 1 | America | 1,124,276 | 12.80% |
| 2 | Japan | 272,929 | -4.40% |
| 3 | Germany | 252,505 | -10.50% |
| 4 | France | 211,765 | -12.80% |
| 5 | England | 186,210 | -4.30% |
| 6 | Canada | 153,497 | 5.30% |
| 7 | Netherland | 126,391 | -2.20% |
| 8 | Italy | 118,986 | -5.70% |
| 9 | Australia | 99,969 | 11.80% |
| 10 | Spain | 93,860 | 1.20% |
| 11 | Korea | 67,572 | 6.20% |
| 12 | Mexico | 66,295 | 18.50% |
| 13 | Belgium | 66,024 | -14.80% |
| 14 | Sweden | 52,108 | -12.00% |
| 15 | Russia | 49,551 | -36.00% |
| 16 | Swiss | 47,978 | -16.90% |
| 17 | Austria | 45,893 | -11.30% |
| 18 | Poland | 42,153 | 3.80% |
| 19 | Brazil | 38,175 | -18.10% |
| 20 | Turkey | 34,742 | -0.80% |
The sheet above showed the major 20 headgear & parts import countries in the first half of 2015. America topped the list, followed by Japan and Germany. During this period, America’s import value was USD 1124 million, up 12.8%. Japan’s was USD 273 million, down 4.4% and Germany’s was USD 253 million, down 10.5%.
Major Headgear & Parts Import Countries in the first half of 2015
| No. | Import Regions | Import Value(Thousand USD) | Y-O-Y |
| 1 | China | 2,176,809 | 11.30% |
| 2 | Germany | 177,075 | -15.30% |
| 3 | Italy | 163,392 | -14.20% |
| 4 | America | 145,222 | 6.80% |
| 5 | France | 127,872 | -5.80% |
| 6 | England | 104,910 | -10.00% |
| 7 | Netherland | 101,141 | -22.90% |
| 8 | Belgium | 74,347 | -8.10% |
| 9 | Mexico | 70,014 | 11.30% |
| 10 | Korea | 66,627 | -12.10% |
| 11 | Japan | 55,969 | -15.00% |
| 12 | Taiwan | 53,903 | -8.50% |
| 13 | Spain | 49,203 | -3.80% |
| 14 | Poland | 40,472 | -10.10% |
| 15 | Thailand | 31,804 | 5.80% |
| 16 | Czech Republic | 29,107 | -17.10% |
| 17 | Portugal | 27,486 | -19.60% |
| 18 | Sweden | 27,319 | -21.30% |
| 19 | Canada | 27,122 | -13.20% |
| 20 | Austria | 20,804 | 6.40% |
showed major 20 headgear & parts import countries in the first half of 2015. China topped the list, followed by Germany and Italy. During this time, China’s headgear & parts import value was USD 2177 million, up 11.3%. Germany’s was USD 177 million, down 15.3% and Italy’s was USD 163 million, down 14.2%.


