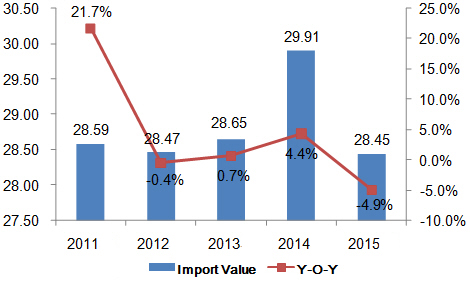
Annual Export Trends of Global Hand-Operated Spanners

From 2011 to 2015, export value of global hand-operated spanners were USD 2,859,000,000, USD 2,847,000,000, USD 2,865,000,000, USD 2,991,000,000, USD 2,845,000,000. The export value in 2015 fell 4.9% on year, down 0.5% on 2011.
Top Hand-Operated Spanners Importers
| No. | Importer | Import Value(USD) | on Year |
| 1 | United States | 615,871,000 | -7.10% |
| 2 | Germany | 197,709,000 | -0.20% |
| 3 | France | 122,526,000 | -6.50% |
| 4 | Canada | 119,055,000 | -9.10% |
| 5 | United Kingdom | 108,016,000 | -4.60% |
| 6 | China | 101,426,000 | -16.80% |
| 7 | Mexico | 74,262,000 | 4.70% |
| 8 | Netherland | 68,519,000 | -18.00% |
| 9 | Japan | 63,728,000 | -7.10% |
| 10 | Poland | 61,427,000 | -2.30% |
The top importers of hand-operated spanners were the United States, Germany and France in 2015.
Top Hand-Operated Spanners Exporters
| No. | Exporter | Export Value(USD) | on Year |
| 1 | China | 773,346 | -7.80% |
| 2 | Taiwan | 561,189 | -2.50% |
| 3 | United States | 278,185 | -8.80% |
| 4 | Germany | 242,108 | -8.40% |
| 5 | India | 141,083 | -9.80% |
| 6 | Netherland | 61,750 | 4.60% |
| 7 | United Kingdom | 59,753 | -8.20% |
| 8 | France | 49,993 | -8.70% |
| 9 | Japan | 49,960 | -10.90% |
| 10 | Spain | 48,729 | -7.70% |
The top exporters of hand-operated spanners were China, Germany and the United States in 2015.
Source:


