Export Origins of China’s Medical, Surgical & Dental Furniture
| District | Export Value | Percentage |
| Guangdong | 287,848,672 | 37.57% |
| Jiangsu | 150,514,715 | 19.64% |
| Zhejiang | 89,179,791 | 11.64% |
| Shanghai | 71,928,901 | 9.39% |
| Fujian | 27,517,573 | 3.59% |
The top origins of China’s medical, surgical & dental furniture were Guangdong, Zhejiang and Jiangsu province in 2015. Guangdong province exported USD 287,848,672, making the largest export origin in China.
Export Destinations for China’s Medical, Surgical & Dental Furniture in 2015
| No. | Country | Volume(Unit) | Value(USD) | On Year | |
| Volume | Value | ||||
| 1 | United States | 20,046,257 | 168,341,711 | 8.80% | 23.80% |
| 2 | Japan | 1,013,121 | 46,985,927 | 3.70% | -7.20% |
| 3 | United Kingdom | 1,787,256 | 40,377,869 | 50.60% | -2.70% |
| 4 | Malaysia | 1,317,863 | 31,043,645 | 157.10% | 62.70% |
| 5 | India | 675,191 | 26,290,420 | 107.10% | 28.80% |
| 6 | Singapore | 622,779 | 23,082,799 | 364.80% | 56.30% |
| 7 | Australia | 350,466 | 22,747,289 | 25.10% | 33.40% |
| 8 | Indonesia | 771,279 | 22,394,927 | 101.80% | -11.90% |
| 9 | Germany | 623,020 | 21,142,989 | -40.30% | 20.70% |
| 10 | Saudi Arabia | 492,549 | 19,086,955 | 379% | 15.50% |

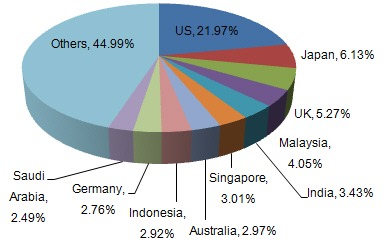
From January to December in 2015, the top export destinations of China’s medical, surgical & dental furniture were the United States, Japan and the United Kingdom. In 2015, China exports to Malaysia grew faster than exports to other markets and the growth was 62.7% on year.
Medical, Surgical & Dental Furniture Demanded Countries in 2015
| Country | Import Value(USD) | on Year |
| United States | 897,235,000 | 4.51% |
| Germany | 198,859,000 | -2.56% |
| Canada | 194,025,000 | 3.94% |
| United Kingdom | 165,817,000 | 1.65% |
| France | 143,282,000 | -10.03% |
The United States ranked first in the demanded countries in 2015 and the import value was USD 897,235,000.
Medical, Surgical & Dental Furniture Export Countries
| Country | Export Value(USD) | on Year |
| China | 766,663,000 | 11.08% |
| United States | 648,140,000 | -1.17% |
| Germany | 527,485,000 | -13.08% |
| Mexico | 226,353,000 | 6.08% |
| Poland | 160,884,000 | -12.31% |
China exported USD 766,663,000 medical, surgical & dental furniture, making the largest export country in 2015. The United States ranked as the second and the exports decreased by 1.17%.


