China's Porcelain Sanitary Fixtures Export Value & Volume
| Month | Volume(kg) | Value(kg) | Y-o-Y | |
| Volume | Value | |||
| January | 116,558,952 | 371,393,341 | 4.20% | 26.90% |
| February | 90,664,445 | 290,883,355 | 121% | 243.40% |
| March | 55,578,368 | 144,839,265 | -26.50% | -1.40% |
| April | 98,189,461 | 243,174,428 | -2.70% | 13.40% |
| May | 112,364,738 | 304,337,165 | -1% | 20.90% |
| June | 118,335,702 | 329,999,848 | 7.60% | 30% |
| July | 115,015,100 | 336,279,840 | -7.30% | 6.30% |
| August | 120,410,967 | 354,073,245 | 1.90% | 5.50% |
| September | 122,106,491 | 460,287,543 | 4.40% | 31.90% |
| October | 119,250,185 | 571,333,255 | 4.30% | 105.80% |
| November | 108,293,576 | 499,049,117 | -7.30% | 69.60% |
| December | 130,573,083 | 463,771,236 | 7.60% | 44.70% |
| Total | 1,307,341,068 | 4,369,421,638 | 3.40% | 39.30% |
From January to December in 2015, China's porcelain sanitary fixtures export volume was 13,073,000 tons, up 3.4% and export value was USD 4,369,000,000, up 39.3% on year.
Major Countries for China's Porcelain Sanitary Fixtures Export
| Month | Volume(kg) | Value(kg) | Y-o-Y | |
| Volume | Value | |||
| January | 116,558,952 | 371,393,341 | 4.20% | 26.90% |
| February | 90,664,445 | 290,883,355 | 121% | 243.40% |
| March | 55,578,368 | 144,839,265 | -26.50% | -1.40% |
| April | 98,189,461 | 243,174,428 | -2.70% | 13.40% |
| May | 112,364,738 | 304,337,165 | -1% | 20.90% |
| June | 118,335,702 | 329,999,848 | 7.60% | 30% |
| July | 115,015,100 | 336,279,840 | -7.30% | 6.30% |
| August | 120,410,967 | 354,073,245 | 1.90% | 5.50% |
| September | 122,106,491 | 460,287,543 | 4.40% | 31.90% |
| October | 119,250,185 | 571,333,255 | 4.30% | 105.80% |
| November | 108,293,576 | 499,049,117 | -7.30% | 69.60% |
| December | 130,573,083 | 463,771,236 | 7.60% | 44.70% |
| Total | 1,307,341,068 | 4,369,421,638 | 3.40% | 39.30% |

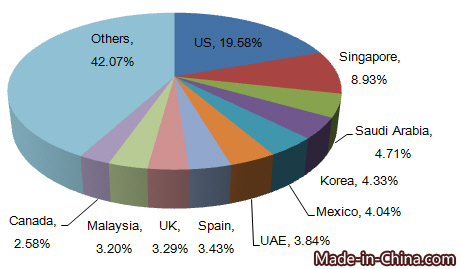
The United Kingdom, Singapore and Saudi Arabia top the list of market for China's porcelain sanitary fixtures export. Other countries included Korea, Mexico, Spain, Malaysia and Canada. In the top ten markets, China's export value to Mexico increased the fastest in 2015, up 264.3% by year.
Export Origins of China's Porcelain Sanitary Fixtures
| No. | Provinces | Volume(kg) | Value(USD) | Y-o-Y | |
| Volume | Value | ||||
| 1 | Guangdong | 612,656,817 | 3,084,666,548 | 0.60% | 40.90% |
| 2 | Hebei | 387,122,573 | 456,109,822 | 12.20% | 22.40% |
| 3 | Fujian | 82,257,750 | 142,586,392 | 2.80% | 18.50% |
| 4 | Shandong | 51,980,599 | 141,140,694 | 9.20% | 93.80% |
| 5 | Xinjiang | 5,317,465 | 97,184,620 | 7.60% | 476.20% |
| 6 | Zhejiang | 20,599,163 | 54,433,641 | -12.60% | 15.30% |
| 7 | Chongqing | 6,902,737 | 52,770,342 | 5.30% | 217.70% |
| 8 | Jiangxi | 9,069,093 | 50,718,375 | -7% | 85.30% |
| 9 | Hubei | 37,523,715 | 37,223,955 | 26.50% | 50.50% |
| 10 | Guangxi | 1,344,351 | 37,138,501 | 1390% | 42739.10% |
Guangdong was China's main export origins of porcelain sanitary fixtures. From January to December in 2015, Guangdong's porcelain sanitary export accounted for 70.60% of China's total.


