China Seats and Parts Thereof Export Volume and Value, from Jan. to Dec. 2014
| Month | Volume(-) | Value(USD) | Compared with the same period last year | |
| Volume | Value | |||
| Jan. | 125,137,894 | 2,603,608,979 | 10.4% | 8% |
| Feb. | 61,017,882 | 1,113,167,352 | -16.7% | -27.1% |
| Mar. | 99,857,132 | 1,781,779,446 | 10.5% | 7.1% |
| Apr. | 112,939,405 | 2,055,687,682 | 14.9% | 5.4% |
| May | 112,634,211 | 2,025,264,084 | 14.6% | -1.5% |
| Jun. | 96,701,238 | 1,811,084,674 | 9.7% | -1.4% |
| Jul. | 101,402,228 | 1,969,942,615 | 13.8% | 9.8% |
| Aug. | 95,318,006 | 1,910,897,805 | 8.9% | 15.2% |
| Sep. | 91,423,304 | 1,801,938,352 | 9.4% | 13.3% |
| Oct. | 94,583,667 | 1,905,297,332 | 3.9% | 0.1% |
| Nov. | 103,438,690 | 2,177,204,092 | 3.5% | -0.5% |
| Dec. | 114,480,120 | 2,430,232,915 | 5.2% | 2.1% |
| Total | 1,208,933,777 | 23,586,105,328 | 7.8% | 2.7% |
China Seats and parts thereof Export Value achieved 23.59 billion dollars, which increased 2.7% year-on-year, from Jan. to Dec. 2014.
China Seats and Parts Thereof Major Export Countries/Regions Distribution, from Jan. to Dec. 2014
| Code | Country | Volume(-) | Value(USD) | Compared with the same period last year | |
| Volume | Value | ||||
| 1 | USA | 397,150,460 | 7,180,612,163 | 3.8% | 2.5% |
| 2 | Japan | 84,938,329 | 1,586,891,047 | 8.5% | 11.1% |
| 3 | United Kingdom | 45,749,681 | 1,157,264,153 | 16% | 5.4% |
| 4 | Germany | 65,185,889 | 1,089,308,969 | 11.9% | 5.4% |
| 5 | Australia | 26,726,416 | 863,192,071 | 1.4% | -0.2% |
| 6 | Canada | 39,819,814 | 806,062,243 | -0.1% | -6.5% |
| 7 | Republic of Korea | 31,850,504 | 693,185,312 | 19.8% | 16.6% |
| 8 | Malaysia | 28,833,688 | 625,641,518 | 19.1% | -14.9% |
| 9 | France | 24,896,143 | 607,811,221 | 13.4% | 9.6% |
| 10 | Singapore | 12,651,725 | 606,825,923 | 27.5% | 9.5% |

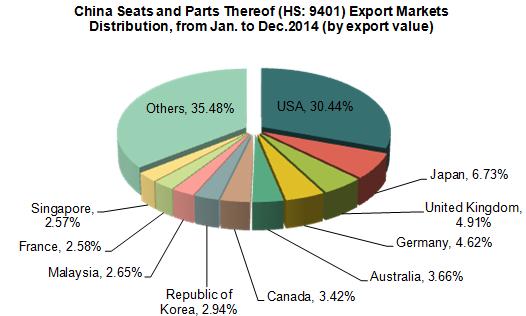
Judging from the export data, from Jan. to Dec.2014, China Seats and parts thereof major export markets are USA, Japan, United Kingdom, Germany, Australia, Canada, Republic of Korea, Malaysia, France, and Singapore and so on.
USA is the biggest export market of China Seats and parts thereof , the total exports from China to USA are 7.18 billion US dollars, which increased 2.5% year-on-year, accounted for 30.44% of the total exports, which followed by Japan, which accounted for 6.73% of the market share.
China Seats and Parts Thereof Major Export Original Places of Exported Goods, from Jan. to Dec. 2014
| Code | Region | Volume(-) | Value(USD) | Compared with the same period last year | |
| Volume | Value | ||||
| 1 | Guangdong | 358,328,023 | 10,581,579,890 | 8.9% | 0.8% |
| 2 | Zhejiang | 426,633,371 | 6,606,124,798 | 10.9% | 12.6% |
| 3 | Jiangsu | 139,907,792 | 1,805,876,668 | 2.9% | 3.6% |
| 4 | Shanghai | 84,250,650 | 1,373,611,090 | -3.9% | 2.6% |
| 5 | Fujian | 70,388,422 | 848,449,505 | 0.9% | 4% |
| 6 | Shandong | 38,005,146 | 695,089,870 | 22.9% | 27.3% |
| 7 | Hebei | 32,344,905 | 462,802,684 | 29.2% | 28% |
| 8 | Tianjin | 11,832,265 | 218,137,397 | 32.8% | 14.1% |
| 9 | Jiangxi | 6,294,924 | 205,889,439 | 4.7% | -22.6% |
| 10 | Liaoning | 5,921,162 | 143,236,938 | -20.8% | -40.4% |
Guangdong, Zhejiang, Jiangsu and Shanghai are the major original places of exported goods of China Seats and parts thereof, the four province total exports accounted for 83.47% of the China total export volumes, the export value accounted for 86.35% of the total.
China Medical Furniture and Barber Chair Export Volume and Value, from Jan. to Dec. 2014
| Month | Volume(Unit) | Value(USD) | Compared with the same period last year | |
| Volume | Value | |||
| Jan. | 492,794 | 62,598,651 | 44.5% | 25.6% |
| Feb. | 1,213,515 | 29,862,359 | 413% | -24.1% |
| Mar. | 2,456,100 | 45,035,689 | 860% | 17.8% |
| Apr. | 3,312,168 | 50,005,097 | 925.7% | 5.9% |
| May | 4,486,608 | 51,025,612 | 1185.1% | -0.6% |
| Jun. | 3,581,920 | 55,316,271 | 604.1% | 4.5% |
| Jul. | 4,092,317 | 62,248,520 | 1021% | 20.4% |
| Aug. | 4,032,418 | 62,714,411 | 1008.6% | 16.7% |
| Sep. | 4,094,816 | 60,637,057 | 1176% | 27.1% |
| Oct. | 3,786,228 | 61,456,028 | 999.3% | 21.3% |
| Nov. | 4,192,539 | 67,760,997 | 850.3% | 16.9% |
| Dec. | 4,469,918 | 82,007,734 | 1285% | 44% |
| Total | 40,211,341 | 690,668,426 | 863.8 | 15.6 |
China Medical furniture and barber chair cumulative Export Volume was about 40.21 million units, which increased 863.8% year-on-year; export value achieved 691 million US dollars, which increased 15.6% year-on-year.
China Medical Furniture and Barber Chair Major Export Countries/Regions Distribution, from Jan. to Dec. 2014
| Code | Country | Volume(Unit) | Value(USD) | Compared with the same period last year | |
| Volume | Value | ||||
| 1 | USA | 18,420,321 | 135,990,132 | 1321.4% | 2% |
| 2 | Japan | 977,374 | 50,606,680 | 314.4% | 13.6% |
| 3 | United Kingdom | 1,187,004 | 41,518,401 | 412% | -4.4% |
| 4 | Indonesia | 382,244 | 25,433,276 | 217.2% | 144% |
| 5 | India | 325,956 | 20,404,579 | 185.6% | 19.9% |
| 6 | Malaysia | 512,518 | 19,082,842 | 481.9% | 43.3% |
| 7 | Germany | 1,044,429 | 17,523,359 | 830.6% | -1.9% |
| 8 | Australia | 280,048 | 17,055,940 | 213.3% | 10.7% |
| 9 | Saudi Arabia | 102,835 | 16,528,352 | 47.1% | 13.5% |
| 10 | Venezuela | 42,582 | 15,734,531 | 464.1% | 742.6% |

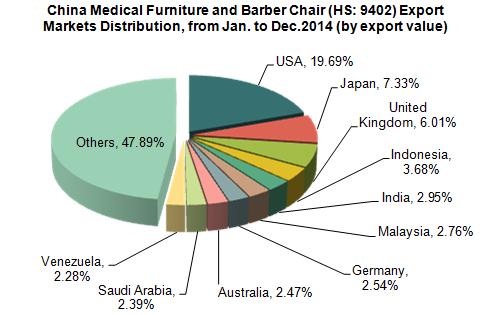
Judging from the export data from Jan. to Dec. 2014, China Medical furniture and barber chair Major Export markets are USA, Japan, United Kingdom, Indonesia, India, Malaysia, Germany, Australia, Saudi Arabia, and Venezuela and so on.
USA, Japan and United Kingdom are the first-three export market of China Medical furniture and barber chair, the export value to them accounted for 19.69%, 7.33% and 6.01% of the total export value.
From Jan. to Dec. 2014, among the first-ten China Medical furniture and barber chair markets, the export value from China to Venezuela increased the fastest, which increased 742.6% year-on-year.
China Medical Furniture and Barber Chair Major Export Original Places of Exported Goods, from Jan. to Dec. 2014
| Code | Region | Volume(Unit) | Value(USD) | Compared with the same period last year | |
| Volume | Value | ||||
| 1 | Guangdong | 11,475,728 | 266,919,230 | 644.9% | 21.1% |
| 2 | Jiangsu | 15,507,480 | 172,808,072 | 1806% | 16.5% |
| 3 | Zhejiang | 8,321,730 | 74,209,539 | 977% | 17.5% |
| 4 | Shanghai | 1,874,130 | 65,291,426 | 339.6% | 4.1% |
| 5 | Fujian | 1,290,730 | 29,680,498 | 422.2% | 0.1% |
| 6 | Beijing | 97,370 | 21,915,754 | 1005.7% | 14.7% |
| 7 | Hebei | 334,838 | 15,227,872 | 218.7% | -5.1% |
| 8 | Shandong | 127,954 | 8,604,509 | 99% | 11.9% |
| 9 | Tianjin | 332,428 | 5,358,723 | 262.1% | 46.5% |
| 10 | Jiangxi | 168,270 | 4,518,823 | 1118.6% | 41.8% |
Guangdong and Jiangsu are the original places of exported goods of China medical furniture and barber chair, from Jan. to Dec. 2014, the above two provinces' total export volumes accounted for 67.1% of the total export, the export value accounted for 63.67% of the total. Among China first-ten medical furniture and barber chair original places of exported goods, the export value of Tianjin increased the largest year-on-year, which increased 46.5%.
China Other Furniture and Parts Thereof Export Volume and Value, from Jan. to Dec. 2014
| Month | Volume(-) | Value(USD) | Compared with the same period last year | |
| Volume | Value | |||
| Jan. | 161,904,016 | 3,050,997,840 | -6.1% | 1.5% |
| Feb. | 60,737,978 | 1,066,949,057 | -34.7% | -42.8% |
| Mar. | 99,534,846 | 1,694,783,528 | -22.2% | -7.4% |
| Apr. | 122,215,927 | 2,188,373,299 | -21.2% | -13.3% |
| May | 139,380,245 | 2,375,395,495 | 2.4% | -6.8% |
| Jun. | 123,599,999 | 2,234,463,971 | -13.6% | -3.8% |
| Jul. | 142,594,873 | 2,558,826,777 | 0.2% | 8.9% |
| Aug. | 135,672,287 | 2,529,395,386 | -4.9% | 17.5% |
| Sep. | 121,261,243 | 2,483,974,801 | -12.4% | 16.3% |
| Oct. | 118,758,707 | 2,430,791,106 | -14.6% | -2.6% |
| Nov. | 130,151,229 | 2,749,839,840 | -16.1% | 0.2% |
| Dec. | 143,526,642 | 3,074,599,125 | -8.8% | 6% |
| Total | 1,499,337,992 | 28,438,390,225 | -11.9% | -1.5% |
China other furniture and parts thereof Export Value was about 28.44 billion US dollars, which declined 1.5% year-on-year, from Jan. to Dec. 2014.
China Other Furniture and Parts Thereof Major Export Countries/Regions Distribution, from Jan. to Dec. 2014
| Code | Country | Volume(-) | Value(USD) | Compared with the same period last year | |
| Volume | Value | ||||
| 1 | USA | 470,658,271 | 7,760,910,921 | 1.9% | 1.8% |
| 2 | Malaysia | 35,756,274 | 1,350,740,983 | -48.8% | -19.2% |
| 3 | Japan | 89,083,171 | 1,312,646,948 | 0.7% | 4.2% |
| 4 | Hong Kong | 66,265,108 | 1,232,007,723 | -33.1% | -10.3% |
| 5 | Singapore | 33,551,765 | 1,222,032,915 | -32% | 12.3% |
| 6 | United Kingdom | 62,558,777 | 1,209,786,427 | -0.7% | 5.1% |
| 7 | Australia | 62,978,962 | 995,249,562 | 11.9% | -0.2% |
| 8 | Germany | 66,726,894 | 869,242,484 | 5.5% | 0.7% |
| 9 | UAE | 22,952,921 | 828,409,086 | -59.3% | -26.5% |
| 10 | Canada | 38,520,355 | 719,219,806 | -5% | -8.7% |

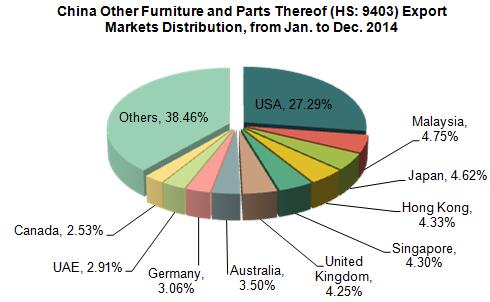
Judging from the export data, from Jan. to Dec.2014, China other furniture and parts thereof major export markets are USA, Malaysia, Japan, Hong Kong, Singapore, United Kingdom, Australia, Germany, UAE, and Canada and so on.
USA, Malaysia and Japan are the first-three export market of China other furniture and parts thereof, the export value to them accounted for 27.29%, 4.75% and 4.62% of the total export value.
China Other Furniture and Parts Thereof Major Export Original Places of Exported Goods, from Jan. to Dec. 2014
| Code | Region | Volume(-) | Value(USD) | Compared with the same period last year | |
| Volume | Value | ||||
| 1 | Guangdong | 593,574,036 | 14,870,210,206 | -1.8% | 3.8% |
| 2 | Zhejiang | 198,652,056 | 3,219,482,377 | 3.3% | 4.2% |
| 3 | Fujian | 141,781,025 | 2,089,688,019 | -7.4% | 2.5% |
| 4 | Shandong | 100,937,168 | 1,717,474,223 | -18.9% | -3.5% |
| 5 | Jiangsu | 140,245,312 | 1,585,897,017 | -1.1% | 4.8% |
| 6 | Shanghai | 85,140,109 | 1,407,077,994 | 8% | 5.9% |
| 7 | Jiangxi | 33,052,939 | 594,870,112 | -56% | -33.2% |
| 8 | Hebei | 29,825,608 | 544,870,473 | -11.5% | 11.7% |
| 9 | Liaoning | 37,651,982 | 418,704,325 | 1.1% | -15.5% |
| 10 | Tianjin | 42,584,903 | 372,268,545 | 20.2% | 7.2% |
Guangdong is the original places of exported goods of China Other furniture and parts thereof, from Jan. to Dec. 2014, the export volumes accounted for 39.59% of the total export, and the export value accounted for 52.29% of the total.
China Spring Mattresses; Bedding and Similar Articles Export Volume and Value, from Jan. to Dec. 2014
| Month | Volume(-) | Value(USD) | Compared with the same period last year | |
| Volume | Value | |||
| Jan. | 95,866,682 | 760,587,220 | 11.4% | 15% |
| Feb. | 42,186,723 | 317,591,558 | -23.8% | -27.7% |
| Mar. | 71,927,431 | 568,814,043 | 7.5% | 8.6% |
| Apr. | 88,714,772 | 688,858,788 | 7.8% | 7% |
| May | 89,337,131 | 680,134,191 | 0.8% | 0.7% |
| Jun. | 82,393,659 | 630,418,922 | -1.1% | -0.9% |
| Jul. | 87,958,656 | 685,845,867 | 6.5% | 8.6% |
| Aug. | 92,487,996 | 716,855,530 | 5.6% | 8.4% |
| Sep. | 94,872,045 | 726,382,171 | 5.4% | 5.9% |
| Oct. | 97,717,111 | 743,312,465 | 9.4% | 5.7% |
| Nov. | 89,809,159 | 707,151,040 | -2.4% | -2.1% |
| Dec. | 83,923,957 | 685,785,087 | -0.7% | 0.2% |
| Total | 1,017,195,322 | 7,911,736,882 | 2.9% | 3.2% |
China spring mattresses; Bedding and similar articles export value achieved 7.91 billion US dollars, which increased 3.2% year-on-year, from Jan. to Dec. 2014.
China Spring Mattresses; Bedding and Similar Articles Major Export Countries/Regions Distribution, from Jan. to Dec. 2014
| Code | Country | Volume(-) | Value(USD) | Compared with the same period last year | |
| Volume | Value | ||||
| 1 | USA | 348,935,894 | 2,496,359,013 | 3.2% | 1.2% |
| 2 | Japan | 146,288,496 | 1,130,637,842 | -5.2% | -5.1% |
| 3 | Australia | 32,159,837 | 316,047,228 | 3.8% | 0.8% |
| 4 | United Kingdom | 37,131,493 | 270,853,739 | 12.3% | 11.2% |
| 5 | Germany | 33,670,765 | 240,034,264 | 7.7% | 5.1% |
| 6 | Republic of Korea | 28,617,995 | 237,835,658 | 8% | 20.3% |
| 7 | Canada | 26,569,789 | 215,286,384 | -3.3% | -2.1% |
| 8 | Thailand | 12,691,043 | 148,577,488 | 27% | 45.8% |
| 9 | UAE | 17,981,126 | 147,627,424 | 8.7% | 10% |
| 10 | Saudi Arabia | 17,034,405 | 134,756,706 | 19.2% | 17.7% |

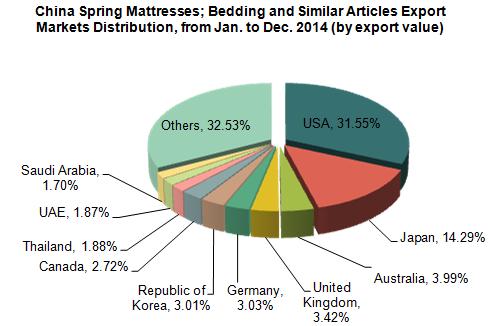
Judging from the export data, from Jan. to Dec.2014, China spring mattresses; Bedding and similar articles major export markets are USA, Japan, Australia, United Kingdom, Germany, Republic of Korea, Canada, Thailand, UAE, and Saudi Arabia and so on.
USA, Japan, Australia are the first-three export market of china spring mattresses; Bedding and similar articles, the export value to them accounted for 31.55%, 14.29% and 3.99% of the total export value.
China Spring Mattresses; Bedding and Similar Articles Major Export Original Places of Exported Goods, from Jan. to Dec. 2014
| Code | Region | Volume(KG) | Value(USD) | Compared with the same period last year | |
| Volume | Value | ||||
| 1 | Zhejiang | 350,353,974 | 2,378,480,455 | 1.9% | 3.5% |
| 2 | Jiangsu | 337,439,196 | 2,273,768,507 | 5.2% | 10.3% |
| 3 | Guangdong | 71,322,319 | 1,159,234,266 | 5.7% | -3.1% |
| 4 | Shanghai | 89,256,606 | 678,416,093 | 1.6% | -1.1% |
| 5 | Shandong | 87,948,995 | 621,568,076 | 0.2% | -0.7% |
| 6 | Fujian | 10,998,202 | 220,634,708 | -17.4% | 10.1% |
| 7 | Anhui | 28,595,266 | 175,526,470 | 29.8% | 12% |
| 8 | Xinjiang Uygur Autonomous Region | 7,279,519 | 57,509,499 | -23.6% | -15.4% |
| 9 | Liaoning | 4,742,786 | 45,791,952 | -4.5% | -19.5% |
| 10 | Jiangxi | 5,992,263 | 45,154,141 | 9.5% | -18% |
Zhejiang, Jiangsu and Guangdong are the original places of exported goods of China spring mattresses; Bedding and similar articles, from Jan. to Dec. 2014, the export volumes of the above provinces accounted for 74.63% of the total export, and the export value accounted for 73.45% of the total.
Source: China Customs


