2010-2012 The USA imports of Ceramic Sanitary Trend
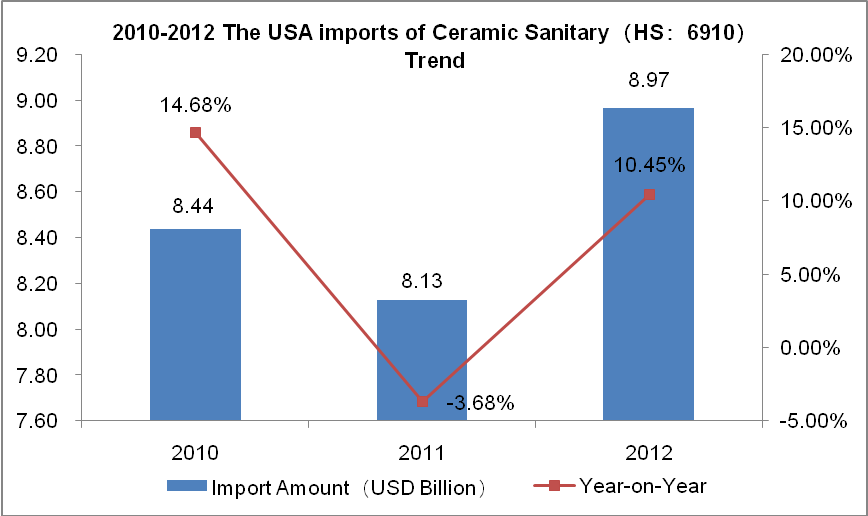
From 2010 to 2012, the ceramic sanitary ware import amount of the USA appears inverted "V" shape. In 2012 the total imports approximately $ 897 million, with an increase of 10.45%.
Jan.-Oct. 2012 The USA imports of Ceramic Sanitary Monthly Trend
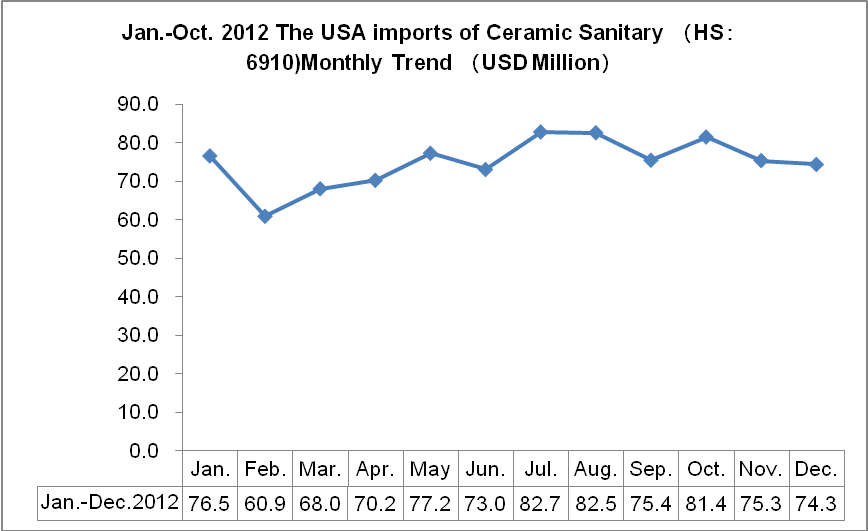
From January to December 2012, the monthly trend of the USA ceramic sanitary import amount shows slightly higher in the second half than in the first half, and February is the trough.
Jan.-Oct. 2012 The USA Ceramic Sanitary Major Importing Countries / Regions
| Countries & Regions | Cumulative Importing Amount(USD)Jan.-Oct. 2012 | Year-on-Year Rate | Proportion of % |
| Total | 897,461 | 10.45% | 100.00% |
| China | 419,311 | 13.93% | 46.72% |
| Mexico | 345,887 | 9.78% | 38.54% |
| Thailand | 44,788 | 0.53% | 4.99% |
| Colombia | 12,714 | -0.88% | 1.42% |
| Turkey | 9,414 | 14.26% | 1.05% |
| India | 7,115 | 60.50% | 0.79% |
| Japan | 6,203 | 13.28% | 0.69% |
| Italy | 5,741 | 8.28% | 0.64% |
| Britain | 5,183 | -10.50% | 0.58% |
| Indonesia | 5,029 | 4.62% | 0.56% |
From January to December 2012, the major exporting countries for the USA Ceramic Sanitary are China and Mexico, which respectively take its total imports of 46.72% and 38.54 %.
South Korean Ceramic Sanitary Ware(HS:6910)Import Situation
2010-2012 South Korean Imports of Ceramic Sanitary Chart
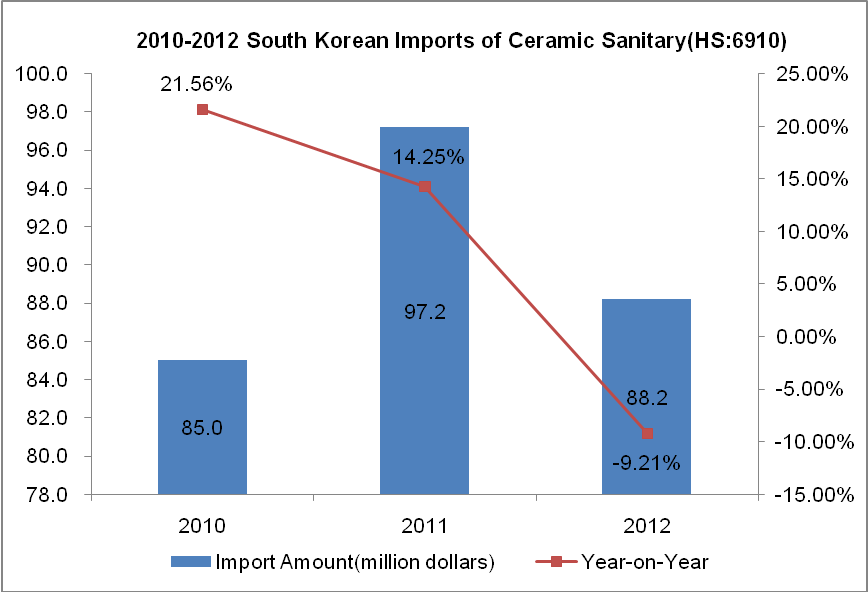
From 2010 to 2012, South Korean imports of ceramic sanitary appear inverted "V" shaped, in 2012 the total imports approximately $ 8.82 billion, which with a decline of 9.21%.
Jan.-Dec. 2012 South Korean Imports of Ceramic Sanitary Monthly Trend
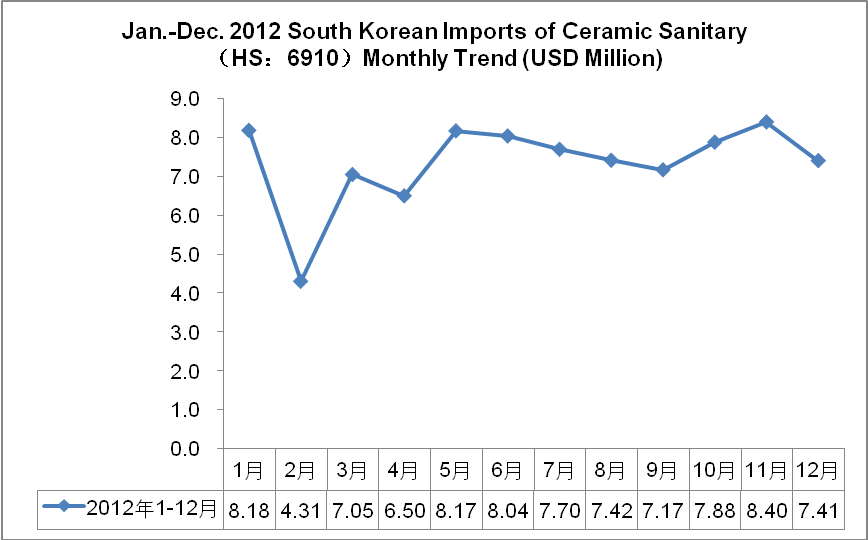
From January to December 2012, the monthly trend of South Korean ceramic sanitary import amount shows slightly higher in the second half than in the first half, and February is the trough.
Jan.-Dec. 2012 South Korean Ceramic Sanitary Major Importing Countries / Regions
| Countries & Regions | Total Imports Jan.-Dec. 2012(USD Thousand) | Year-on-Year Proportion | Proportion of | |
| Total | 88,219 | -9.21% | 100.00% |
|
| China | 82,957 | -6.05% | 94.04% |
|
| Norway | 2,061 | -2.46% | 2.34% |
|
| Thailand | 682 | -42.83% | 0.77% |
|
| The USA | 502 | -39.52% | 0.57% |
|
| Italy | 360 | -72.77% | 0.41% |
|
| Japan | 302 | -80.52% | 0.34% |
|
| Germany | 243 | -27.89% | 0.28% |
|
| Finland | 219 | -29.81% | 0.25% |
|
| Vietnam | 209 | -56.55% | 0.24% |
|
| Taiwan | 193 | 87.38% | 0.22% |
|
China is the major exporting country for South Korean Ceramic Sanitary, which takes 94.04% of the total imports.
The Philippines Ceramic Sanitary Ware(HS:6910)Import Situation
2010-2012 The Philippines Imports of Ceramic Sanitary Trend
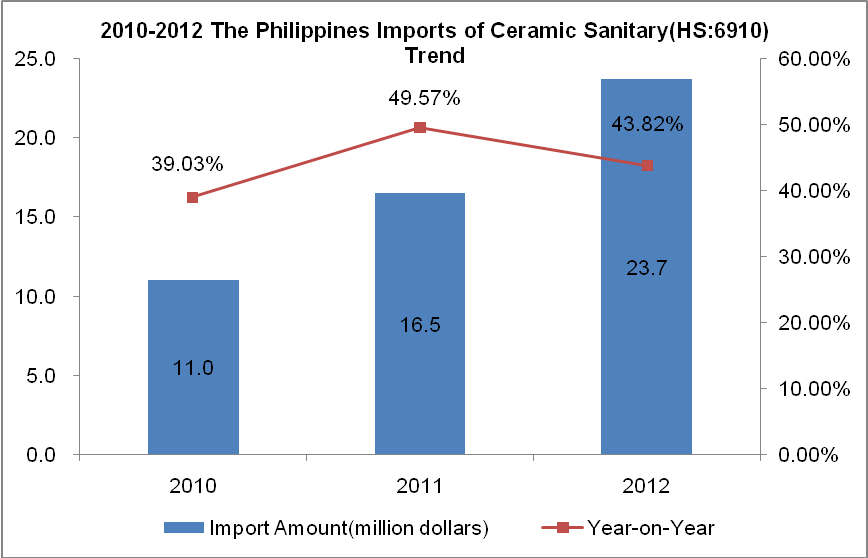
From 2010 to 2012, the Philippines imports of ceramic sanitary is growing year by year, in 2012 the total imports approximately $ 2.37 billion, with a year-on-year increase of 43.82%.
Jan.-Dec. 2012 The Philippines Imports of Ceramic Sanitary Monthly Trend
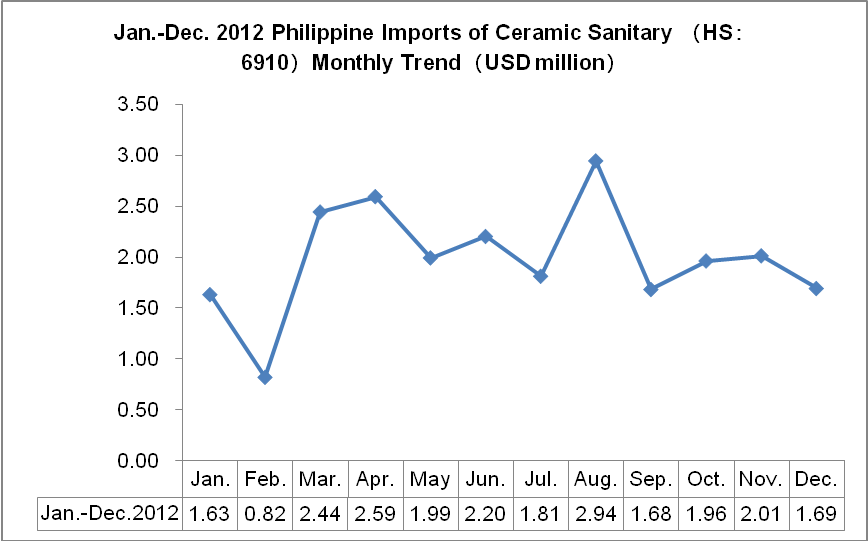
From January to December 2012, it is a relatively large fluctuation based on monthly trend of Philippines imports of ceramic sanitary, August is the peak, and February is the trough.
Jan.-Dec. 2012 the Philippines Ceramic Sanitary Major Importing Countries / Regions
| Countries & Regions | Total Imports Jan.-Dec. 2012(USD Thousand) | Year-on-Year Proportion | Proportion of |
| Total | 23,749 | 43.82% | 100.00% |
| China | 17,017 | 82.00% | 71.65% |
| Thailand | 3,963 | -33.71% | 16.69% |
| Japan | 1,108 | 369.49% | 4.67% |
| Vietnam | 560 | 4566.67% | 2.36% |
| Spain | 212 | 105.83% | 0.89% |
| Singapore | 156 | 15.56% | 0.66% |
| Indonesia | 155 | 868.75% | 0.65% |
| Germany | 147 | 68.97% | 0.62% |
| Taiwan | 145 | 302.78% | 0.61% |
| Hong Kong | 86 | 79.17% | 0.36% |
China is the major exporting country for the Philippines Ceramic Sanitary importing, which takes 71.65% of the total imports.
(Source: UN COMTRADE)


