LED Lighting Industry Data Statistical Description:
The LED bulb, lighting, lamps only constituted by a single semiconductor component are classified into HS :85414010. The LED bulb, lighting, lamps only constituted by two or more semiconductor components are classified into HS: 94054090.
HS Code 85414010,94054090
| HS code | Product name |
| 85414010 | light emitting diode |
| 94054090 | other light |
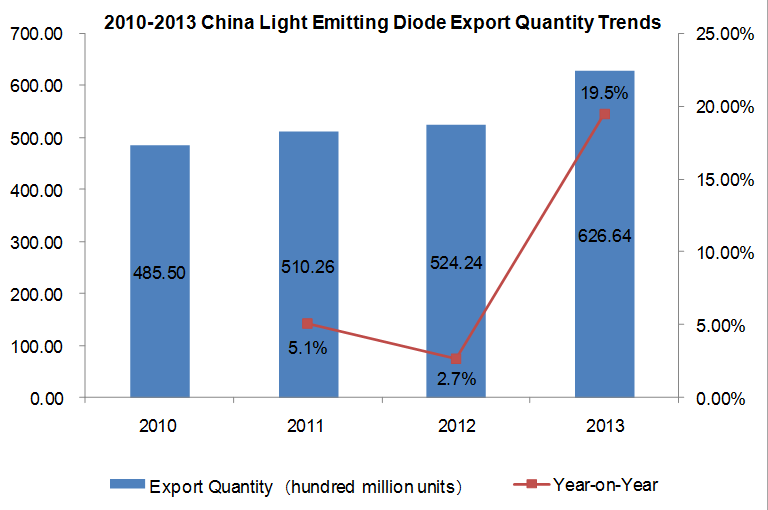
2010-2013 China Light Emitting Diode Export Quantity Trends

As what showed in the picture, Export Quantity of China light emitting diode is in rising Trends from 2010 to 2013.
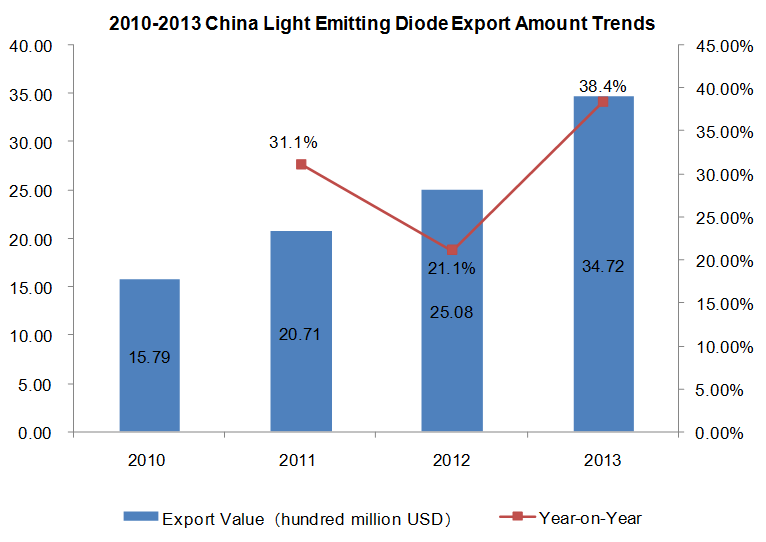
2010-2013 China Light Emitting Diode Export Amount Trends

As what showed in the picture, the Export Amount of China light emitting diode was in rising Trends from 2010 to 2013. The increase of 2013 Export Amount reached 38.4%.
2010-2013 China Light Emitting Diode Export Market Analysis
| No | Country/Region | Export Amount(USD) | |||
| 2010 | 2011 | 2012 | 2013 | ||
| 1 | Hongkong | 894,448,878 | 1,083,524,376 | 1,139,318,393 | 1,997,693,940 |
| 2 | South Korea | 247,040,147 | 439,390,050 | 732,386,662 | 692,938,510 |
| 3 | Japan | 93,498,439 | 209,700,019 | 211,700,736 | 215,262,339 |
| 4 | Taiwan | 162,254,049 | 142,340,931 | 115,535,163 | 115,225,516 |
| 5 | Iran | 1,857,964 | 2,212,506 | 2,070,207 | 63,145,008 |
| 6 | Singapore | 17,227,445 | 23,014,662 | 43,770,283 | 52,223,004 |
| 7 | USA | 32,915,503 | 28,400,278 | 41,434,448 | 44,837,595 |
| 8 | India | 19,155,639 | 26,808,234 | 41,835,427 | 42,359,876 |
| 9 | Vietnam | 1,515,657 | 2,164,813 | 23,766,824 | 34,971,023 |
| 10 | Germany | 19,515,120 | 18,871,039 | 25,120,777 | 31,435,021 |
| 11 | Philippines | 560,226 | 591,984 | 6,177,729 | 26,830,167 |
| 12 | Malaysia | 6,529,838 | 6,990,616 | 20,084,233 | 21,483,682 |
| 13 | Hungary | 14,886,500 | 10,549,882 | 8,917,577 | 13,613,065 |
| 14 | Italy | 7,307,749 | 7,319,228 | 7,392,896 | 9,941,793 |
| 15 | Poland | 2,653,003 | 2,622,924 | 2,402,721 | 9,844,380 |
| 16 | Turkey | 5,432,354 | 7,980,635 | 8,269,414 | 9,839,964 |
| 17 | Thailand | 7,981,682 | 6,328,893 | 7,572,750 | 9,448,571 |
| 18 | Indonesia | 1,775,175 | 2,277,270 | 6,818,636 | 8,927,696 |
| 19 | Brazil | 6,853,892 | 8,869,538 | 7,990,748 | 8,604,560 |
| 20 | Russian Federation | 3,728,358 | 6,186,782 | 5,508,359 | 6,345,368 |
The top three Export Markets of China light emitting diode are Hongkong, South Korea and Japan.
2010-2013 China Light Emitting Diode Export Market Proportion Analysis
| No | Country/Region | Amount proportion | |||
| 2010 | 2011 | 2012 | 2013 | ||
| 1 | Hongkong | 56.64% | 52.32% | 45.43% | 57.54% |
| 2 | South Korea | 15.64% | 21.22% | 29.20% | 19.96% |
| 3 | Japan | 5.92% | 10.13% | 8.44% | 6.20% |
| 4 | Taiwan | 10.27% | 6.87% | 4.61% | 3.32% |
| 5 | Iran | 0.12% | 0.11% | 0.08% | 1.82% |
| 6 | Singapore | 1.09% | 1.11% | 1.75% | 1.50% |
| 7 | USA | 2.08% | 1.37% | 1.65% | 1.29% |
| 8 | India | 1.21% | 1.29% | 1.67% | 1.22% |
| 9 | Vietnam | 0.10% | 0.10% | 0.95% | 1.01% |
| 10 | Germany | 1.24% | 0.91% | 1.00% | 0.91% |
| 11 | Philippines | 0.04% | 0.03% | 0.25% | 0.77% |
| 12 | Malaysia | 0.41% | 0.34% | 0.80% | 0.62% |
| 13 | Hungary | 0.94% | 0.51% | 0.36% | 0.39% |
| 14 | Italy | 0.46% | 0.35% | 0.29% | 0.29% |
| 15 | Poland | 0.17% | 0.13% | 0.10% | 0.28% |
| 16 | Turkey | 0.34% | 0.39% | 0.33% | 0.28% |
| 17 | Thailand | 0.51% | 0.31% | 0.30% | 0.27% |
| 18 | Indonesia | 0.11% | 0.11% | 0.27% | 0.26% |
| 19 | Brazil | 0.43% | 0.43% | 0.32% | 0.25% |
| 20 | Russian Federation | 0.24% | 0.30% | 0.22% | 0.18% |
The data showed the Export amounts to Hongkong, South Korea , and Japan accounted for 57.54%, 19.96% and 6.2% of China total export amount.
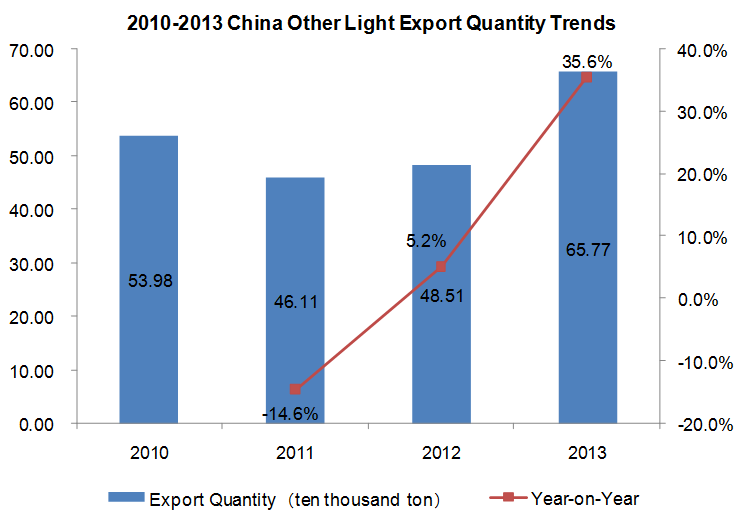
2010-2013 China Other Light Export Quantity Trends

The data showed Export Quantity of China other light in 2011 was less than 2010. But the Export Quantity of China other light is in the growth Trends from 2011 to 2013.
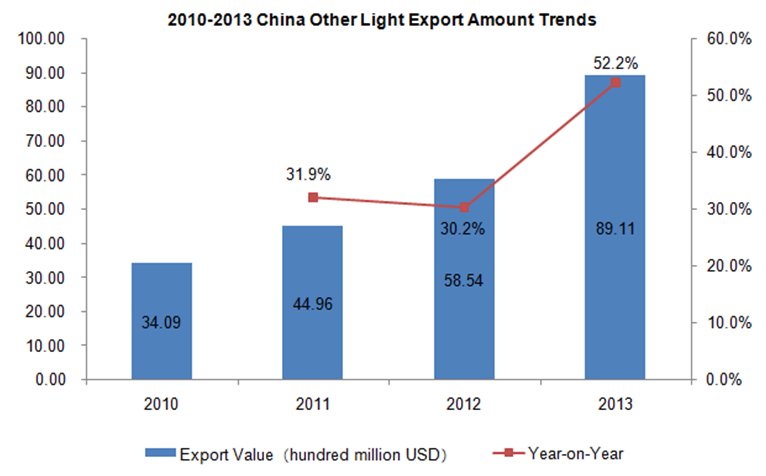
2010-2013 China Other Light Export Amount Trends

The data showed the Export Amount of China other light was in growth Trends from 2010 to 2013. The increasing of Export Amount of China other light in 2013 reached 52.2%.
2010-2013 China Other Light Export Market Analysis
| No | Country/Region | Export Amount(USD) | |||
| 2010 | 2011 | 2012 | 2013 | ||
| 1 | USA | 861,127,389 | 1,031,128,712 | 1,424,687,322 | 2,029,445,988 |
| 2 | Germany | 256,029,210 | 364,556,061 | 467,288,493 | 726,877,262 |
| 3 | Japan | 186,872,578 | 551,264,215 | 724,234,502 | 603,984,330 |
| 4 | England | 155,622,433 | 167,151,481 | 226,977,427 | 385,037,233 |
| 5 | Hongkong | 183,580,405 | 255,469,600 | 268,227,654 | 340,673,136 |
| 6 | Russian Federation | 64,332,620 | 112,406,544 | 167,213,971 | 330,349,700 |
| 7 | Netherlands | 157,381,062 | 179,666,183 | 201,633,036 | 309,134,382 |
| 8 | France | 150,039,531 | 161,035,173 | 186,919,634 | 278,184,717 |
| 9 | Australia | 94,998,770 | 117,478,008 | 172,603,960 | 259,855,457 |
| 10 | Canada | 112,109,296 | 126,422,843 | 141,169,273 | 226,214,889 |
| 11 | Italy | 105,455,982 | 117,995,564 | 130,841,767 | 203,875,190 |
| 12 | Spain | 73,973,870 | 89,541,410 | 107,383,903 | 184,585,500 |
| 13 | South Korea | 31,259,318 | 34,229,040 | 58,322,181 | 149,097,579 |
| 14 | Turkey | 42,625,520 | 68,158,264 | 73,295,833 | 138,848,077 |
| 15 | Brazil | 33,521,000 | 50,332,963 | 69,351,355 | 133,505,850 |
| 16 | Poland | 46,332,027 | 60,893,976 | 85,135,166 | 133,269,806 |
| 17 | Indonesia | 17,594,367 | 26,177,660 | 49,973,576 | 131,611,680 |
| 18 | United Arab Emirates | 32,739,050 | 37,810,839 | 55,207,441 | 128,839,580 |
| 19 | Sweden | 41,093,209 | 47,262,612 | 66,555,501 | 127,645,613 |
| 20 | Malaysia | 24,197,761 | 30,153,538 | 37,678,170 | 119,118,160 |
The top three Export Markets of China other light were USA, Germany and Japan. The Export Amount to USA, Germany and Japan were 2.029 billion USD, 727 million USD and 604 million USD.
2010-2013 China Other Light Export Market Proportion Analysis
| No | Country/Region | Amount proportion | |||
| 2010 | 2011 | 2012 | 2013 | ||
| 1 | USA | 25.26% | 22.93% | 24.34% | 22.77% |
| 2 | Germany | 7.51% | 8.11% | 7.98% | 8.16% |
| 3 | Japan | 5.48% | 12.26% | 12.37% | 6.78% |
| 4 | England | 4.57% | 3.72% | 3.88% | 4.32% |
| 5 | Hongkong | 5.39% | 5.68% | 4.58% | 3.82% |
| 6 | Russian Federation | 1.89% | 2.50% | 2.86% | 3.71% |
| 7 | Netherlands | 4.62% | 4.00% | 3.44% | 3.47% |
| 8 | France | 4.40% | 3.58% | 3.19% | 3.12% |
| 9 | Australia | 2.79% | 2.61% | 2.95% | 2.92% |
| 10 | Canada | 3.29% | 2.81% | 2.41% | 2.54% |
| 11 | Italy | 3.09% | 2.62% | 2.24% | 2.29% |
| 12 | Spain | 2.17% | 1.99% | 1.83% | 2.07% |
| 13 | South Korea | 0.92% | 0.76% | 1.00% | 1.67% |
| 14 | Turkey | 1.25% | 1.52% | 1.25% | 1.56% |
| 15 | Brazil | 0.98% | 1.12% | 1.18% | 1.50% |
| 16 | Poland | 1.36% | 1.35% | 1.45% | 1.50% |
| 17 | Indonesia | 0.52% | 0.58% | 0.85% | 1.48% |
| 18 | United Arab Emirates | 0.96% | 0.84% | 0.94% | 1.45% |
| 19 | Sweden | 1.21% | 1.05% | 1.14% | 1.43% |
| 20 | Malaysia | 0.71% | 0.67% | 0.64% | 1.34% |
The data showed the Export amounts to USA, Germany and Japan accounted for 22.77%, 8.16% and 6.78% of China total export amount.


