2013 China Tea Export Analysis
2013 China Tea Export Value Analysis
2013 China Tea Export Value
| Product | Cumulative from Jan. to Dec. | Compared to the same period last year | ||
|
| Amount(KG) | Value($) | Amount | Amount |
| 0902 Tea,whether flavored or not | 325,774,859 | 1,246,851,966 | 3.9% | 19.6% |
| 09021090 Green tea, the package≤3kg | 153,385,290 | 621,930,149 | 15.1% | 25.3% |
| 09022090 Green tea, the package > 3kg | 111,105,577 | 310,572,679 | -3.8% | 19.8% |
| 09024090 Black tea and other semi-fermented tea, the package > 3kg | 27,549,299 | 73,995,379 | -10.3% | 0.8% |
| 09024010 Oolong tea, the package > 3kg | 15,312,774 | 65,878,246 | 2.8% | 22.2% |
| 09023090 Black tea and other semi-fermented tea, the package≤3kg | 5,327,261 | 54,369,843 | 3.4% | 19.7% |
| 09022010 Scented tea, the package > 3kg | 4,642,423 | 36,027,904 | 1.9% | 33.4% |
| 09024020 Pu’er tea, the package > 3kg | 3,886,348 | 32,869,107 | 6.4% | 13.7% |
| 09023010 Oolong tea, the package≤3kg | 1,724,241 | 21,608,212 | -30.5% | -16.7% |
| 09021010 Scented tea, the package≤3kg | 2,213,884 | 19,151,579 | -20% | -22% |
| 09023020 Pu’er tea, the package≤3kg | 627,762 | 10,448,868 | -1% | 43% |
In 2013, China exported 325,800 tons of tea in total, and the total exports amounted to $1.247 billion, respectively growing by 3.9% and 19.6%.
2013 Tea Industry Export Structure (by export value)
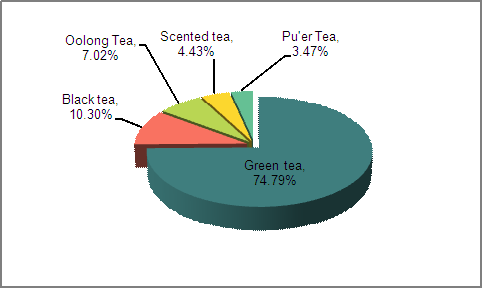
In 2013, China export volume of Green tea is 264,500 tons, and export value amounted to $ 933 million, accounting for 74.79% of total tea exports. Export volume and value of Black tea were respectively 32,900 tons and $ 128 million, accounting for 10.3% of total tea exports. Export volume and value of Oolong tea were respectively 1.7 million tons and $ 087 million, accounting for 7.02% of total tea exports. Export volume and value of Scented tea were respectively 6,900 tons and $ 55 million, accounting for 4.43% of total tea exports. Export volume and value of Pu'er tea were respectively 4,500 tons and $ 43 million, accounting for 3.47% of total tea exports.
2013 Export Unit Price of Tea Industry
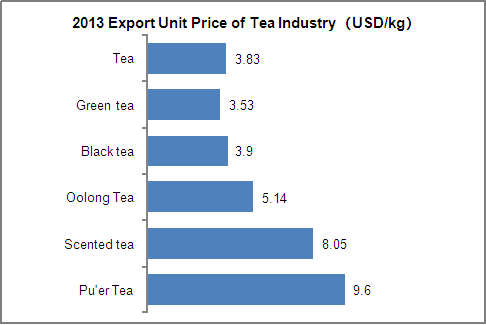
In 2013, the average export price of tea is $ 3.83/ kg; Pu’er tea has the highest average export price, which was $ 9.6 / kg; Green tea has the lowest average export price, which was only $ 3.53 / kg. The average export prices of Black tea, Oolong tea, and Scented tea were respectively $ 3.9/ kg, $ 5.14/ kg and $ 8.05/ kg.
2013 China Tea Export Market Analysis
Distribution of 2013 China Tea Exporting Countries and Regions
| No. | Country/ Region | Amount(KG) | Value($) | Compared to the same period last year | |
|
|
|
|
| Amount | Value |
| 1 | Morocco | 61,190,976 | 211,569,381 | 9.7% | 15.9% |
| 2 | United States | 22,077,681 | 90,719,761 | -9.2% | 5.6% |
| 3 | Hong Kong | 9,759,368 | 83,086,849 | -4.5% | 42.2% |
| 4 | Mauritania | 18,189,520 | 73,845,049 | 45.4% | 50.9% |
| 5 | Japan | 17,551,544 | 66,978,684 | 1.3% | 16.1% |
| 6 | Uzbekistan | 23,415,133 | 52,838,185 | -9.4% | 3.3% |
| 7 | The Russian Federation | 13,525,902 | 52,637,217 | -11.6% | 2.4% |
| 8 | Togo | 12,188,819 | 50,286,597 | 0.1% | 13.3% |
| 9 | Algeria | 13,356,217 | 48,768,650 | -7.2% | 4.2% |
| 10 | Senegal | 10,218,980 | 44,664,864 | 31.6% | 43.8 |
| 11 | Germany | 10,114,505 | 42,050,676 | 9% | 27.2% |
| 12 | Mali | 7,571,500 | 31,167,045 | 17.1% | 28.3% |
| 13 | Gambia | 7,149,615 | 27,194,076 | 54.4% | 52.8% |
| 14 | Vietnam | 768,308 | 22,532,938 | 712.7% | 464.3% |
| 15 | Ghana | 5,774,980 | 21,830,119 | 0.7% | 24.3% |
| 16 | France | 3,892,815 | 20,356,990 | 3.5% | 6.8% |
| 17 | Malaysia | 2,140,597 | 19,154,189 | 21.6% | 77.6% |
| 18 | Australia | 1,404,916 | 16,444,246 | -15.5% | 6.4% |
| 19 | Taiwan | 1,015,603 | 16,322,047 | 60.9% | 88.5% |
| 20 | Niger | 3,812,270 | 15,126,317 | 0.2% | 14.3% |
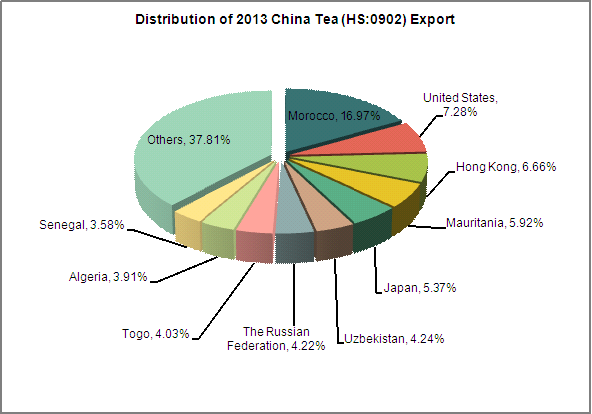
In 2013, China exported tea mostly to Morocco, the United States, Hong Kong, Mauritania, Japan, Uzbekistan, Russian Federation, Togo, Senegal, Algeria and other countries/ regions, which accounts for 62.19% of China total tea exports. Morocco is our most important tea export market; in 2013 China's tea exports to Morocco accounts for 16.97% of the total. Among the top 20 export markets for China tea, in 2013 the tea export value from China to Vietnam grew by 464.3%, growing fastest.
Distribution of 2013 Green Tea Major Exporting Countries and Regions (by export value)
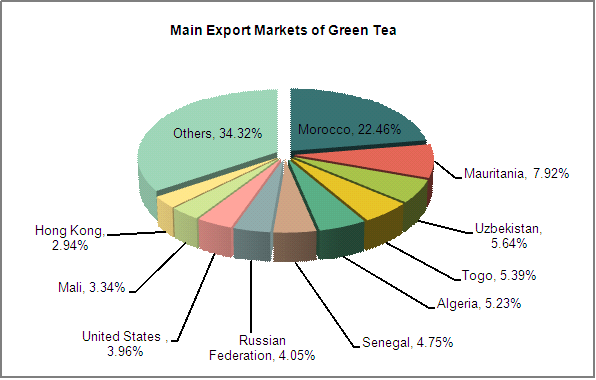
In 2013, Chinese Green tea is mainly exported to Morocco, Mauritania, Uzbekistan, Togo, Algeria, Senegal, the Russian Federation, the United States, Mali and Hong Kong and other countries/ regions, which accounts for 65.68% of China total Green tea exports. Morocco is our most important export market of Green tea; 22.46% of China's Green tea is exported to Morocco in 2013.
Distribution of 2013 Black Tea Major Exporting Countries and Regions (by export value)
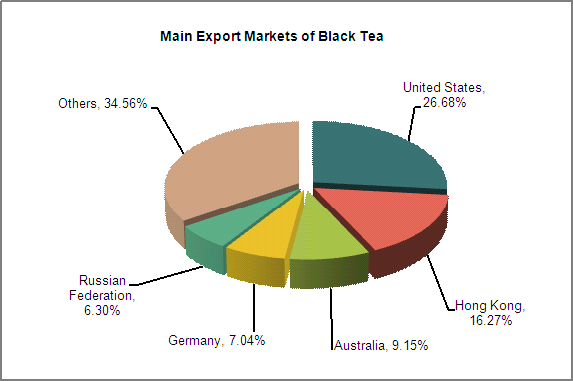
2013, Chinese Black tea is mainly exported to the United States, Hong Kong, Australia, Germany, the Russian Federation, Myanmar, Thailand, Japan and Canada and other countries/ regions. Among them, the United States and Hong Kong are the major export markets of China Black tea. In 2013 China Black tea exporting to the U.S. and Hong Kong respectively accounted for 26.68% and 16.27% of our total Black tea exports.
Distribution of 2013 Oolong Tea Major Exporting Countries and Regions (by export value)
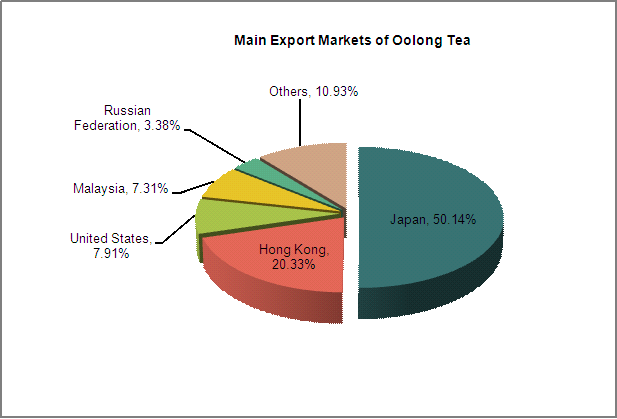
2013, Chinese Oolong tea is mainly exported to Japan, Hong Kong, United States, Malaysia and the Russian Federation and other countries / regions, which accounts for 89.07% of China total Oolong tea exports. Among them, Japan is our most important export market of Oolong tea; in 2013 more than half of China's Oolong tea was exported to Japan. Hong Kong is China's second largest export market of Oolong tea; in 2013 China's Oolong tea export value to Hong Kong accounted for about 1/5 of the total. China's export markets of Oolong tea are much concentrated.
Distribution of 2013 Scented Tea Major Exporting Countries and Regions (by export value)
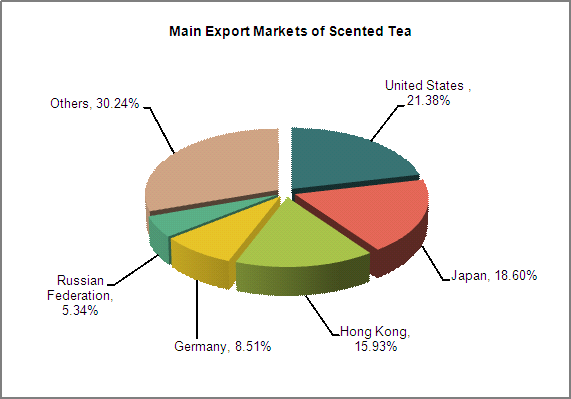
2013, China Scented tea is mainly exported to the United States, Japan, Hong Kong, Germany and the Russian Federation and other countries /regions, which accounts for 69.76% of the total China Scented tea exports. Among them, the United States, Japan and Hong Kong are the major export markets of China Scented tea; 2013 Chinese exports to these three countries/ regions accounted respectively for 21.38%, 18.6% and 15.93% of China total Scented tea exports, total of which accounted for 55.91% of the total.
Distribution of 2013 Pu’er Tea Major Exporting Countries and Regions (by export value)
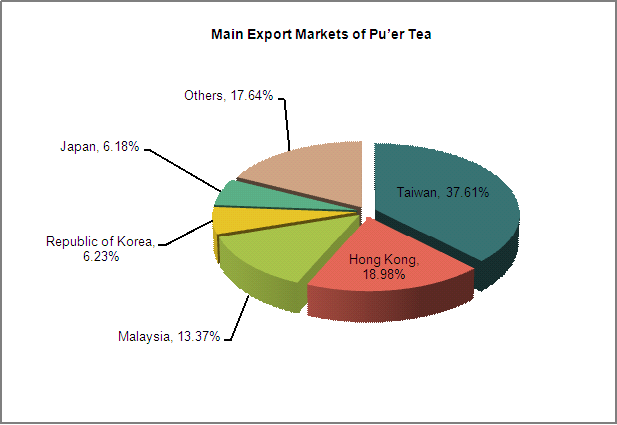
2013, China Pu’er tea is mainly exported to Asia. Taiwan, Hong Kong, Malaysia, South Korea and Japan are our five major tea export market in 2013, totally accounting for 82.36% of China total Pu’er tea exports. 2013 China Pu’er tea exporting to Taiwan, Hong Kong and Malaysia accounted respectively for 37.61%, 18.98% and 13.37% of the total.
2013 China Tea Original Places of Exported Goods
2013 China Tea Original Places Distribution of Export Goods
| Region | Amount(KG) | Value($) | Compared to the same period last year | |
|
|
|
| Amount | Value |
| Zhejiang Province | 189,523,888 | 596,490,957 | 3.4% | 16.2% |
| Anhui Province | 44,851,903 | 164,041,730 | 16.9% | 29% |
| Fujian Province | 16,648,356 | 114,117,856 | 0% | 20.3% |
| Hunan Province | 24,877,386 | 76,566,681 | -10% | -5.7% |
| Hubei Province | 6,918,788 | 69,885,280 | 80.7% | 199.6% |
| Guangdong Province | 8,505,204 | 64,743,181 | -2% | 22.6% |
| Shanghai | 5,244,582 | 54,487,191 | -33.6% | -5.1% |
| Jiangxi Province | 10,585,363 | 42,685,613 | 16.7% | 25.6% |
| Yunnan Province | 7,205,699 | 31,248,353 | 0.9% | 15.5% |
| Henan Province | 3,065,874 | 10,292,195 | 26.6% | 24.4% |
| Guangxi Zhuang Autonomous Region | 1,589,477 | 7,442,990 | -4% | 9% |
| Chongqing | 5,385,350 | 4,988,541 | 17.1% | 15.9% |
| Sichuan Province | 359,396 | 4,552,814 | 44.5% | 40.1% |
| Guizhou Province | 43,048 | 2,112,373 | 18.6% | 43.8% |
| Jiangsu Province | 620,215 | 1,550,267 | -35.9% | -56% |
| Heilongjiang Province | 123,390 | 877,537 | 8.2% | 10.8% |
| Shandong Province | 188,514 | 552,337 | -74.3% | -73.3% |
| Tianjin | 778 | 90,706 | -98.3% | -53.1% |
| Beijing | 6,051 | 75,565 | -24% | 33.6% |
| Xinjiang Uygur Autonomous Region | 30,107 | 37,457 | 29708.9% | 1417.7% |
| Hebei Province | 1,295 | 11,102 | 3824.2% | 735.4% |
| Shanxi Province | 95 | 940 | -87.9% | -83.3% |
| Hainan Province | 100 | 300 | -99.6% | -99.2% |
| Zhejiang Province | 189,523,888 | 596,490,957 | 3.4% | 16.2% |
In 2013, China tea exported mainly from Zhejiang, Anhui and Fujian provinces; tea export value of these three provinces accounted respectively for 47.84%, 13.16% and 9.15% of China's total tea exports, totally accounting for 70% of China total tea exports. In 2013, export value from Hubei, Xinjiang and Hebei respectively grew by 199.6%, 1417.7% and 735.4% compared to the same period last year, growing faster; export value from Jiangsu, Shandong, Tianjin, Shanxi and Hainan, respectively dropped by 56%, 73.3%, 53.1 %, 83.3% and 99.2%, a larger decline.
2013 China Green Tea Original Places Distribution of Export Goods (by export value)
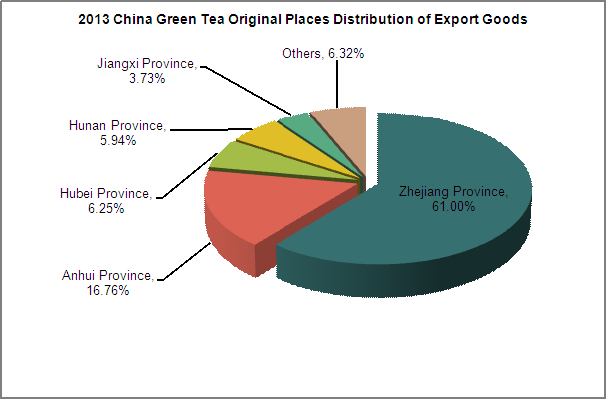
Zhejiang province and Anhui province are major original places of China Green tea exporting, whose export value in 2013 accounted respectively for 61% and 16.76% of our total Green tea exports. More than 60% of China Green tea is exported from Zhejiang province.
2013 China Black Tea Original Places Distribution of Export Goods (by export value)
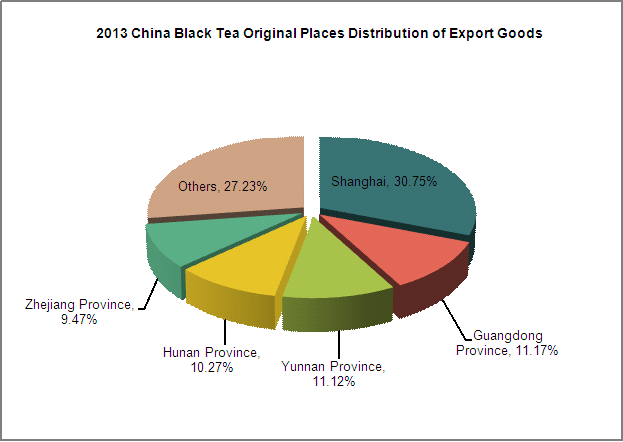
In 2013, China five major original places of Black tea exporting are Shanghai, Guangdong, Yunnan, Hunan and Zhejiang provinces; in 2013 the tea export value of these five provinces accounted for 72.77% of China total Black tea exports. Shanghai is main original places of China Black tea exporting. More than 30% of China Black tea is exported from Shanghai.
2013 Distribution of China Oolong Tea Original Places of Export Goods (by export value)
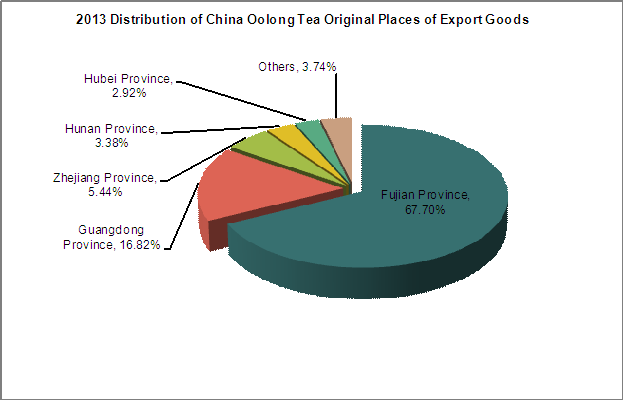
In 2013, China five major original places of Oolong tea exporting are Fujian, Guangdong, Zhejiang, Hunan and Hubei; in 2013, the tea export value of these five provinces accounted for 96.26% of China total Oolong tea exports. Fujian province is main original places of China Oolong tea exporting and 67.6% of 2013 China Oolong tea is exported from Fujian Province. China Oolong tea original places of export goods are much concentrated.
2013 Distribution of China Scented Tea Original Places of Export Goods (by export value)
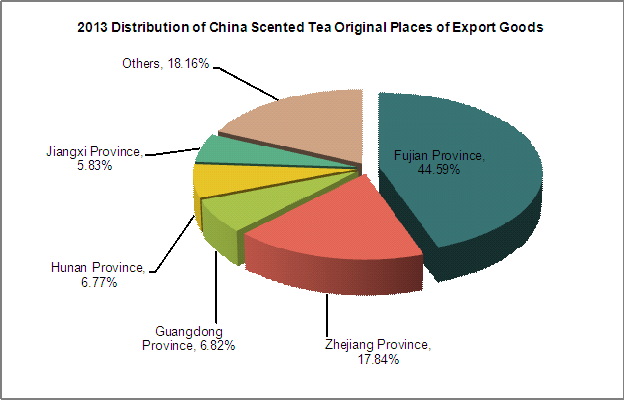
In 2013, China five major original places of Scented tea exporting are Fujian, Zhejiang, Guangdong, Hunan and Jiangxi provinces, and the tea export value of these five provinces accounted for 81.84% of China total Scented tea exports. Fujian Province is main original places of China Scented tea exporting and 44.59% of 2013 China Scented tea is exported from Fujian Province.
2013 Distribution of China Pu’er Tea Original Places of Export Goods (by export value)
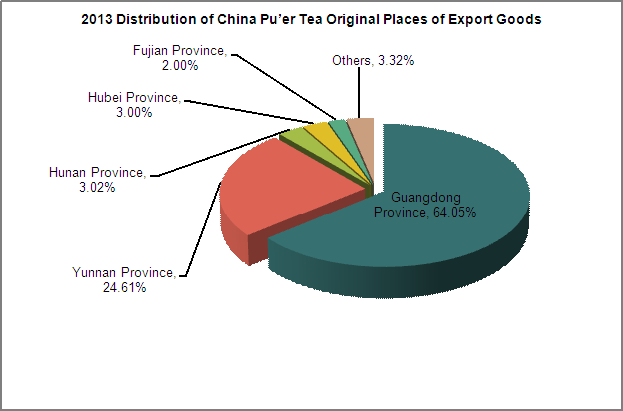
In 2013, China five major original places of Pu’er tea exporting are Guangdong, Yunnan, Hubei, Hunan and Fujian provinces, and the tea export value of these five provinces accounted for 96.68% of China total Pu’er tea exports. Among them, Pu’er tea export value of Guangdong Province and Yunnan respectively accounted for 64.05% and 24.61% of China total Pu’er tea exports, which are China Pu’er tea’s most important export regions.
Source: Customs Information Network


