2010-2012 USA Battery Import Value Trend
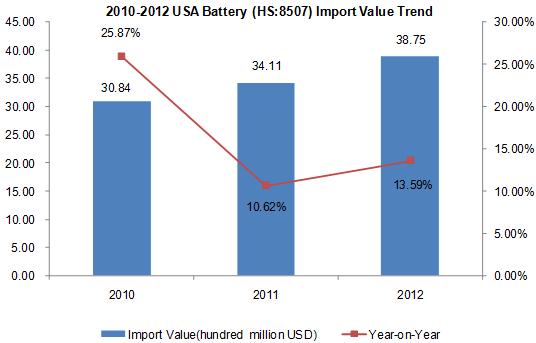
The United States' battery import value from 2010 to 2012 showed an increasing trend, in 2012, the import value amounted to $ 3.875 billion, increased by 13.59% year on year.
2010-2012 USA Battery Import Market Analysis
| No. | Import Country/ Region | Import Value(Thousand USD) | Import Value Growth Compared 2012 with 2010 | ||
| 2010 | 2011 | 2012 | |||
| 1 | China | 1,168,222 | 1,237,233 | 1,300,443 | 11.32% |
| 2 | Japan | 533,685 | 511,344 | 878,192 | 64.55% |
| 3 | Mexico | 543,635 | 579,178 | 630,284 | 15.94% |
| 4 | Republic of Korea | 213,214 | 399,505 | 359,693 | 68.70% |
| 5 | Chinese Taipei | 179,558 | 200,621 | 193,804 | 7.93% |
| 6 | Vietnam | 31,722 | 39,954 | 91,067 | 187.08% |
| 7 | Germany | 55,791 | 76,373 | 61,775 | 10.73% |
| 8 | France | 48,942 | 67,652 | 58,180 | 18.88% |
| 9 | Philippines | 40,249 | 46,809 | 56,541 | 40.48% |
| 10 | United Kingdom | 28,662 | 32,459 | 40,089 | 39.87% |
| 11 | Canada | 46,456 | 22,675 | 23,959 | -48.43% |
| 12 | Sweden | 23,372 | 25,379 | 21,487 | -8.07% |
| 13 | Malaysia | 22,413 | 25,014 | 21,479 | -4.17% |
| 14 | Indonesia | 14,734 | 19,880 | 19,773 | 34.20% |
| 15 | Italy | 29,112 | 21,065 | 19,238 | -33.92% |
| 16 | Switzerland | 4,798 | 10,071 | 15,101 | 214.74% |
| 17 | Hong Kong | 10,151 | 12,092 | 14,889 | 46.68% |
| 18 | Saudi Arabia | 3 | 26 | 7,263 | 242000.00% |
| 19 | Colombia | 5,600 | 11,648 | 7,110 | 26.96% |
| 20 | India | 10,745 | 11,771 | 5,921 | -44.90% |
From 2010 to 2013, the three largest export markets of USA battery were China, Japan and Mexico. Among the top 20 USA battery import markets, the import value from Vietnam, Switzerland and Saudi Arabia respectively increased by 187.08%,214.74% and 242,000% more than in 2010, grew rapidly.
2010-2012 USA Battery Import Market Share Analysis
| No. | Import Country/ Region | Import Value Percentage | ||
| 2010 | 2011 | 2012 | ||
| 1 | China↓ | 37.88% | 36.27% | 33.56% |
| 2 | Japan | 17.31% | 14.99% | 22.66% |
| 3 | Mexico↓ | 17.63% | 16.98% | 16.27% |
| 4 | Republic of Korea | 6.91% | 11.71% | 9.28% |
| 5 | Chinese Taipei | 5.82% | 5.88% | 5.00% |
| 6 | Vietnam↑ | 1.03% | 1.17% | 2.35% |
| 7 | Germany | 1.81% | 2.24% | 1.59% |
| 8 | France | 1.59% | 1.98% | 1.50% |
| 9 | Philippines↑ | 1.31% | 1.37% | 1.46% |
| 10 | United Kingdom↑ | 0.93% | 0.95% | 1.03% |
| 11 | Canada↓ | 1.51% | 0.66% | 0.62% |
| 12 | Sweden↓ | 0.76% | 0.74% | 0.55% |
| 13 | Malaysia | 0.73% | 0.73% | 0.55% |
| 14 | Indonesia | 0.48% | 0.58% | 0.51% |
| 15 | Italy↓ | 0.94% | 0.62% | 0.50% |
| 16 | Switzerland↑ | 0.16% | 0.30% | 0.39% |
| 17 | Hong Kong↑ | 0.33% | 0.35% | 0.38% |
| 18 | Saudi Arabia | / | / | 0.19% |
| 19 | Colombia | 0.18% | 0.34% | 0.18% |
| 20 | India | 0.35% | 0.35% | 0.15% |
Note: “↑”represents that the indicators listed, continued to increase from 2010 to 2012, “↓”represents that the indicators listed, continued to decrease from 2010 to 2012.
From three years of market proportion, the import value proportion of Vietnam, Philippines, the United Kingdom, Switzerland and Hong Kong continued to rise; the country which continues to decline includes China, Mexico, Canada, Sweden and Italy.
January-December 2013 USA Battery Import Situation
| Country/ Region | Total Import Value from Jan.-Dec.2013(Thousand USD) | Year on Year | Percentage |
| Total | 4,289,354 | 10.70% | 100.00% |
| China | 1,321,259 | 1.60% | 30.80% |
| Japan | 1,126,888 | 28.32% | 26.27% |
| Mexico | 680,242 | 7.93% | 15.86% |
| Republic of Korea | 396,667 | 10.28% | 9.25% |
| Chinese Taipei | 180,296 | -6.97% | 4.20% |
| Vietnam | 85,171 | -6.47% | 1.99% |
| Germany | 85,100 | 37.76% | 1.98% |
| France | 61,963 | 6.50% | 1.44% |
| United Kingdom | 57,697 | 43.92% | 1.35% |
| Philippines | 51,267 | -9.33% | 1.20% |
Judging from the statistics of Jan. to Dec. 2013, China was the largest original country of USA battery import, accounting for 30.8% of total import value, followed by Japan, accounting for 26.27% of total imports. Mexico ranked third, accounting for 15.86% of total imports.


