Note: HS Code: 6910, ceramic sinks, wash basins, wash basin pedestals, baths, bidets, toilets, water tanks, urinals and similar sanitary fixtures, hereinafter referred to as "Ceramic Sanitary Ware
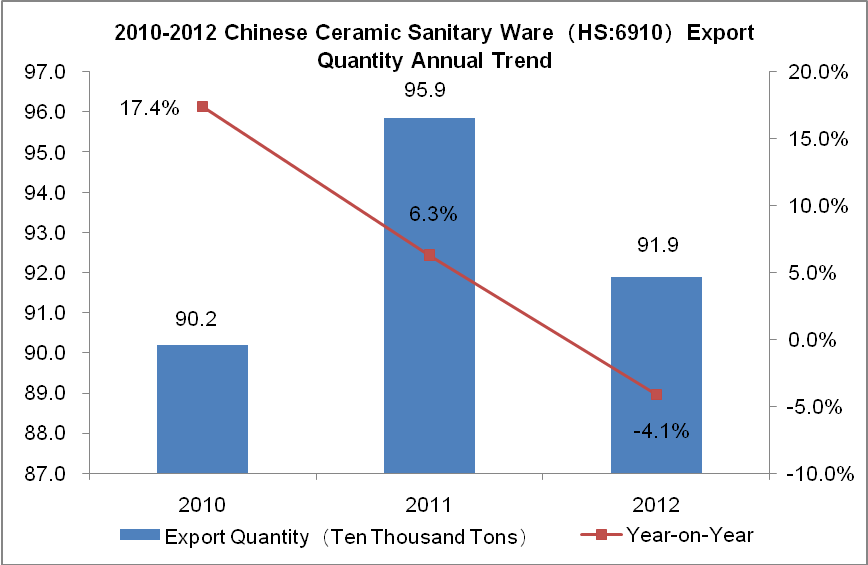
2010-2012 Chinese Ceramic Sanitary Ware(HS:6910)Export Quantity Trend
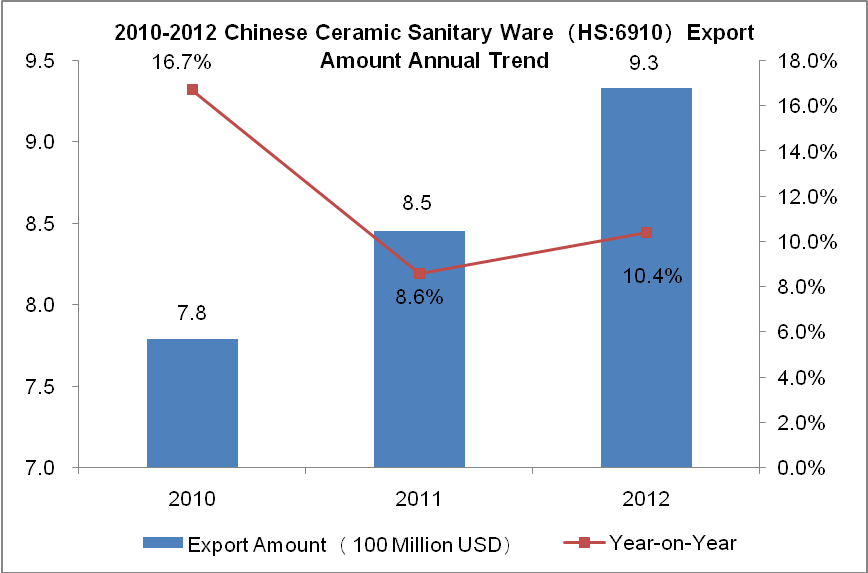
2010-2012 Chinese Ceramic Sanitary Ware(HS:6910)Export Amount Trend
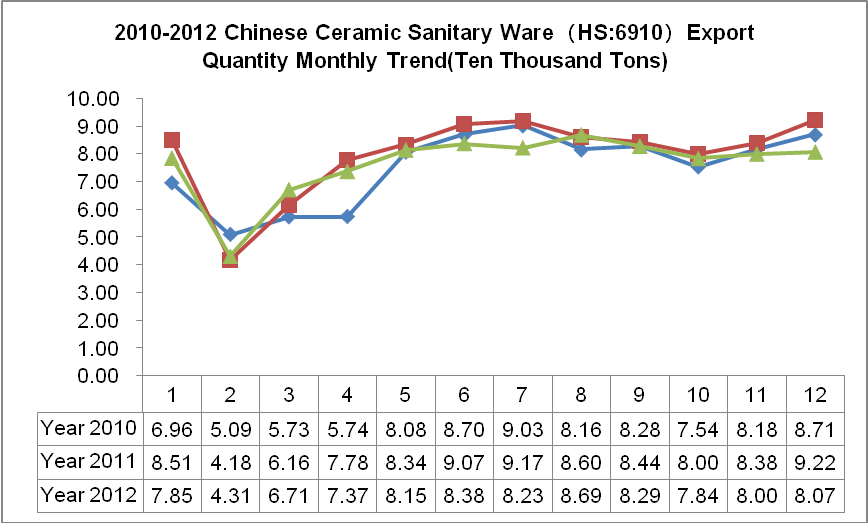
2010-2012 Chinese Ceramic Sanitary Ware(HS:6910)Export Quantity Monthly Trend
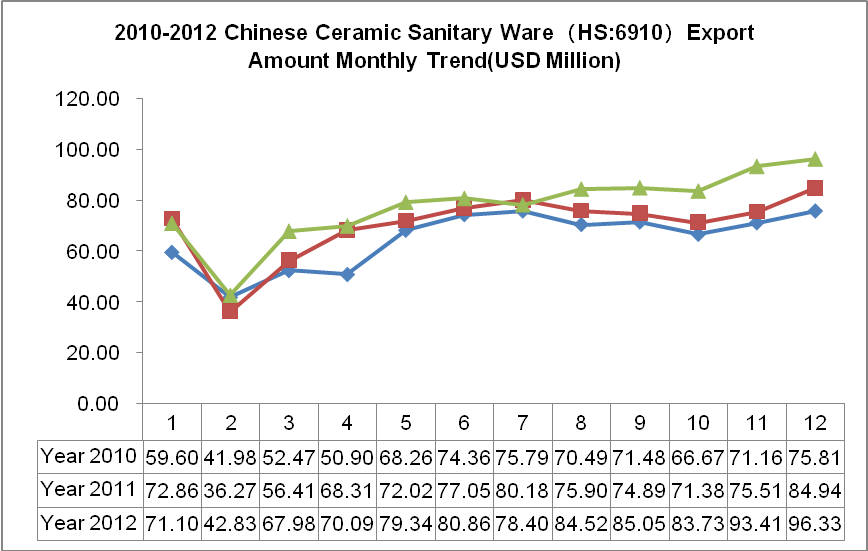
2010-2012 Chinese Ceramic Sanitary Ware(HS:6910)Export Amount Monthly Trend
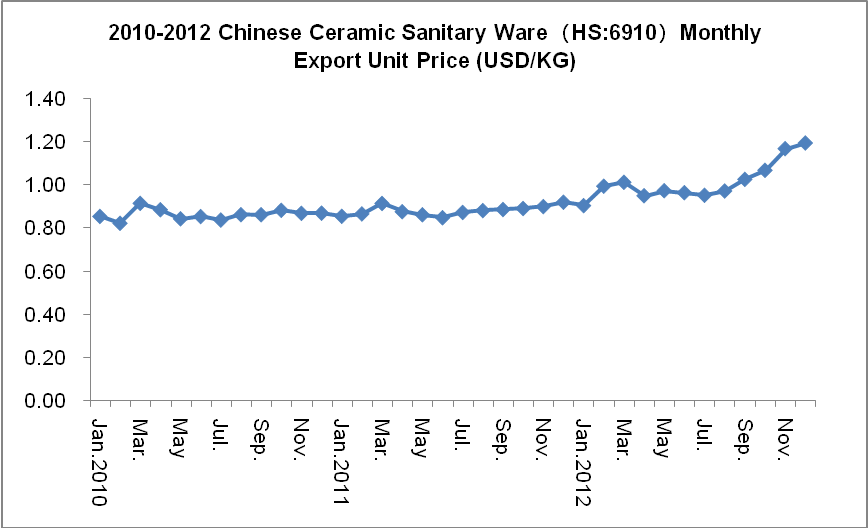
2010-2012 Chinese Ceramic Sanitary Ware(HS:6910)Monthly Export Unit Price (USD/KG)
From 2010 to 2012, the total export volumes of Chinese ceramic sanitary ware appear inverted "V" shape with a year by year increasing. The total export volume in 2012 approximately reached 919,000 tons with a decline of 4.1%; the total export value approximately reached 930 million dollars with a year on year increase of 10.4%. From the chart form of Chinese ceramic sanitary ware monthly export volume in 2010-2012, we would find there is a seasonal export trend of ceramic sanitary ware. Feb. is trough through the whole year.
From 2010 to 2012, Chinese ceramic sanitary monthly average export price in 2012 is slightly higher than the previous 2 years, in December 2012, the average export price of Chinese plastic tub approximately 1.19 U.S. dollars / kg, surpassed the previous three years
1.6. 2010-2012 Chinese Ceramic Sanitary Ware(HS:6910)Major Export Market
| Item | Export Countries/Regions | Export Values(USD) | 2012 Export Growth Rate compared with 2010 | ||
| Year 2010 | Year 2011 | Year 2012 | |||
| 1 | The USA | 228,890,298 | 225,441,900 | 263,413,150 | 15.08% |
| 2 | South Korea | 58,690,798 | 76,727,658 | 81,622,024 | 39.07% |
| 3 | Canada | 53,982,685 | 43,926,478 | 56,098,418 | 3.92% |
| 4 | The Philippines | 11,303,110 | 13,969,535 | 37,659,046 | 233.17% |
| 5 | The United Kingdom | 35,540,740 | 41,297,445 | 36,260,673 | 2.03% |
| 6 | Australia | 30,569,794 | 33,738,470 | 34,954,726 | 14.34% |
| 7 | India | 19,802,392 | 23,152,665 | 22,388,617 | 13.06% |
| 8 | Singapore | 13,017,662 | 13,005,391 | 20,860,933 | 60.25% |
| 9 | Saudi Arabia | 10,857,999 | 15,693,904 | 17,664,059 | 62.68% |
| 10 | Malaysia | 6,411,529 | 8,459,099 | 17,596,640 | 174.45% |
| 11 | Nigeria | 10,437,248 | 14,324,069 | 17,016,001 | 63.03% |
| 12 | Japan | 19,998,416 | 21,590,423 | 16,074,036 | -19.62% |
| 13 | Spain | 16,436,339 | 15,723,186 | 15,665,228 | -4.69% |
| 14 | Taiwan | 10,283,196 | 12,342,754 | 14,727,896 | 43.22% |
| 15 | Russian Federation | 9,279,946 | 11,705,519 | 14,501,892 | 56.27% |
| 16 | Hong Kong | 13,541,570 | 15,668,158 | 14,326,282 | 5.79% |
| 17 | Germany | 13,922,056 | 16,360,788 | 14,127,984 | 1.48% |
| 18 | Indonesia | 4,227,746 | 6,149,887 | 13,684,430 | 223.68% |
| 19 | Thailand | 3,860,306 | 8,493,752 | 10,404,407 | 169.52% |
| 20 | Italy | 15,010,671 | 15,447,819 | 10,202,904 | -32.03% |
2010-2012 Chinese Ceramic Sanitary Ware(HS:6910)Export Market Share
| Item | Export Countries/Regions | Rate of Export Value | ||
| Year 2010 | Year 2011 | Year 2012 | ||
| 1 | The USA | 29.38% | 26.66% | 28.21% |
| 2 | South Korea | 7.53% | 9.07% | 8.74% |
| 3 | Canada | 6.93% | 5.19% | 6.01% |
| 4 | The Philippines↑ | 1.45% | 1.65% | 4.03% |
| 5 | The United Kingdom | 4.56% | 4.88% | 3.88% |
| 6 | Australia | 3.92% | 3.99% | 3.74% |
| 7 | India | 2.54% | 2.74% | 2.40% |
| 8 | Singapore | 1.67% | 1.54% | 2.23% |
| 9 | Saudi Arabia↑ | 1.39% | 1.86% | 1.89% |
| 10 | Malaysia↑ | 0.82% | 1.00% | 1.88% |
| 11 | Nigeria↑ | 1.34% | 1.69% | 1.82% |
| 12 | Japan↓ | 2.57% | 2.55% | 1.72% |
| 13 | Spain↓ | 2.11% | 1.86% | 1.68% |
| 14 | Taiwan↑ | 1.32% | 1.46% | 1.58% |
| 15 | Russian Federation↑ | 1.19% | 1.38% | 1.55% |
| 16 | Hong Kong | 1.74% | 1.85% | 1.53% |
| 17 | Germany | 1.79% | 1.93% | 1.51% |
| 18 | Indonesia↑ | 0.54% | 0.73% | 1.47% |
| 19 | Thailand↑ | 0.50% | 1.00% | 1.11% |
| 20 | Italy↓ | 1.93% | 1.83% | 1.09% |
Note: ↑mean that from 2010 to 2012, the import amount keep rising in the proportion of China's total export amount. ↓mean that from 2010 to 2012, the import amount continued to decline in the proportion of China's total export amount.
(Source: China Customs network)


