2014 Jan. to Mar. Chinese Festive Supplies Export Volume and Value
| Month | Volume (Kg) | Value (U.S. dollar) | Year on Year | |
| Volume | Value | |||
| Jan. | 9,281,279 | 51,566,351 | -1.8% | -13.5% |
| Feb. | 4,467,194 | 21,614,075 | -29.2% | -41.5% |
| Mar. | 5,868,607 | 28,858,190 | -22.4% | -53.7% |
| Total | 19,617,080 | 102,038,616 | -15.9% | -35.8% |
From Jan. to Mar. in 2014, the export value of Chinese festive supplies amounted to 0.102 billion dollars, declined 35.8% year on year.
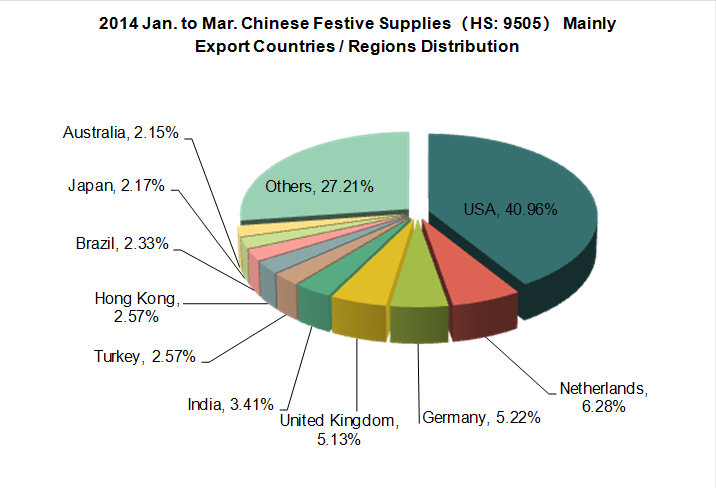
2014 Jan. to Mar. Chinese Festive Supplies Mainly Export Countries / Regions Distribution
| No. | Countries / Regions | Volume (Kg) | Value (U.S. dollar) | Year on Year | |
| Volume | Value | ||||
| 1 | USA | 9,399,870 | 41,798,621 | 33.6% | 7% |
| 2 | Netherlands | 906,789 | 6,407,865 | -5.8% | -31.1% |
| 3 | Germany | 586,818 | 5,323,085 | -42.6% | -47.8% |
| 4 | United Kingdom | 802,082 | 5,233,390 | -19.3% | -47% |
| 5 | India | 1,496,857 | 3,480,222 | -13.4% | -25.9% |
| 6 | Turkey | 257,976 | 2,624,183 | 157.5% | 254.1% |
| 7 | Hong Kong | 513,770 | 2,622,095 | -42% | -35.3% |
| 8 | Brazil | 355,438 | 2,375,597 | -43% | -51.8% |
| 9 | Japan | 228,364 | 2,215,239 | 16.7% | 12.4% |
| 10 | Australia | 261,296 | 2,190,375 | -6.9% | -13.5% |
| 11 | Italy | 407,055 | 2,111,624 | -19.7% | -51.5% |
| 12 | Indonesia | 239,446 | 2,029,440 | 92.3% | 133.4% |
| 13 | Russian Federation | 353,477 | 1,916,435 | -59.2% | -19.4% |
| 14 | Canada | 352,113 | 1,400,403 | -24.5% | -55.1% |
| 15 | Togo | 244,010 | 1,372,066 | 0 | 0 |
| 16 | Singapore | 126,481 | 1,122,710 | -83.8% | -81.7% |
| 17 | Belgium | 226,475 | 1,082,205 | 38.9% | -29.8% |
| 18 | France | 160,579 | 996,575 | -78.2% | -84.5% |
| 19 | Malaysia | 118,657 | 954,617 | -66% | -74.4% |
| 20 | Republic of Korea | 65,743 | 845,431 | -13.2% | -14% |

From Jan. to Mar. in 2014, the mainly export market for Chinese festive supplies were USA, Netherlands, Germany, United Kingdom, etc. Among them, the export value to USA accounted for 40.96% of the total export value of Chinese festive supplies.
2014 Jan. to Mar. Chinese Festive Supplies Original Export Places
| No. | Regions | Volume (Kg) | Value (U.S. dollar) | Year on Year | |
| Volume | Value | ||||
| 1 | Guangdong | 9,690,261 | 41,495,976 | 8.1% | -8.2% |
| 2 | Zhejiang | 5,043,061 | 23,049,401 | 6% | 20.8% |
| 3 | Jiangsu | 741,702 | 7,388,353 | -14.2% | -6.3% |
| 4 | Liaoning | 427,770 | 4,741,108 | 14.1% | 26.2% |
| 5 | Fujian | 1,034,984 | 4,238,184 | -7.2% | -19.7% |
| 6 | Sichuan | 326,542 | 3,266,394 | 110.7% | 62.2% |
| 7 | Shandong | 320,037 | 2,525,988 | -66.9% | -67.8% |
| 8 | Tianjin | 340,972 | 2,444,309 | 269.6% | 316.3% |
| 9 | Henan | 172,880 | 2,188,216 | -90.2% | -90.8% |
| 10 | Anhui | 439,835 | 1,911,829 | -80.5% | -93.1% |
From Jan. to Mar. in 2014, the mainly original export places of Chinese festive supplies were Guangdong, Zhejiang and Jiangsu. Among them, the export value of Guangdong accounted for 40.67% of the total export value of festive supplies. And Zhejiang accounted for 22.59%, Jiangsu accounted for 7.24%.
(Source: China Customs)


