2013 Jan.-Dec.Chinese Chemical Industry Exports (by Export Value)
| Product Name | Unit | Volume | Value ($) | Year on Year | ||
| Volume | Value | |||||
| Plastics and articles thereof | Kg | 19,363,490,967 | 61,769,871,498 | 9.8% | 11.9% | |
| Organic Chemicals | Kg | 11,848,940,037 | 42,211,603,916 | 13% | 4.4% | |
| Rubber and articles thereof | Kg | 6,702,467,672 | 23,134,062,074 | 10.4% | 4.4% | |
| Inorganics; precious metals, rare earth metals, radioactive elements and their compoundsisotopes of organic and inorganic compounds | - | 19,706,241,201 | 13,590,569,275 | 7.4% | -2.8% | |
| Miscellaneous Chemical Products | Kg | 7,314,804,615 | 12,306,796,305 | 12.8% | 12.1% | |
| Tanning,tannins,dyes,paints,inks | Kg | 1,847,440,380 | 5,805,564,884 | 7.6% | 6.1% | |
| Protein substances | Kg | 794,388,281 | 2,454,072,702 | 7% | 10.8% | |
| Photographic and film products | - | 200,450,111 | 1,217,723,886 | -7.4% | 0.5% | |
| Explosives; pyrotechnic products; pyrophoric alloys; combustible materials | Kg | 355,973,624 | 902,224,634 | -2% | 4.7% | |
2013 Jan.-Dec. Chinese Export Enterprises Distribution of Inorganics; Precious Metals, Rare Earth Metals, Radioactive Elements and Their Compounds(by Export Value)
| No. | Regions | Export Value (Billion Dollars) | Year on Year |
| 1 | Jiangsu | 15.63 | -15.4% |
| 2 | Shandong | 13.65 | 3.9% |
| 3 | Fujian | 8.41 | -5.4% |
| 4 | JIangxi | 8.01 | -9.9% |
| 5 | Hunan | 7.98 | -16.2% |
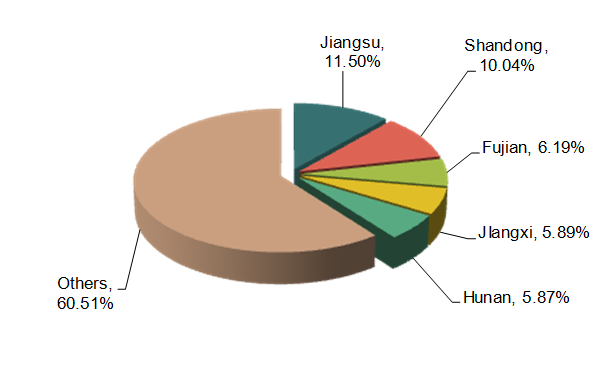
As can be seen from the above chart, Chinese major export sources of Inorganics; precious metals, rare earth metals, radioactive elements and their compounds were Jiangsu, Shandong and Fujian from Jan. to Dec. 2013. The export value of the three provinces respectively accounted for 11.5%, 10.04% and 6.19% of Chinese total export value of these products. Chinese export sources of these products were relatively dispersed.
2013 Jan.-Dec. Chinese Export Enterprises Distribution of Organic Chemicals (by Export Value)
| No. | Regions | Export Value (Billion Dollars) | Year on Year |
| 1 | Jiangsu | 116.88 | 6.8% |
| 2 | Zhejiang | 73.63 | -1.9% |
| 3 | Shandong | 61.07 | 4% |
| 4 | Shanghai | 28.09 | -1.4% |
| 5 | Hebei | 23.25 | 7.3% |
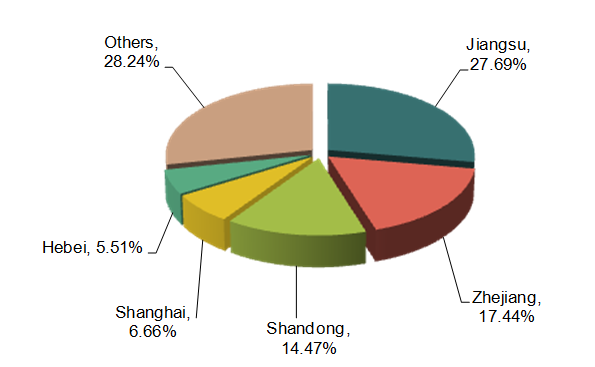
As can be seen from the above chart, Chinese major export sources of organic chemicals were Jiangsu, Zhejiang and Shandong from Jan. to Dec. 2013. Among them, Jiangsu' export value accounted for 27.69% of Chinese total export value of organic chemicals.
2013 Jan.-Dec. Chinese Export Enterprises Distribution of Tanning, Tannins, Dyes, Paints, Inks (by Export Value)
| No. | Regions | Export Value (Billion Dollars) | Year on Year |
| 1 | Jiangsu | 11.59 | 9.5% |
| 2 | Zhejiang | 11.54 | 9.2% |
| 3 | Guangdong | 8.29 | 27.8% |
| 4 | Shanghai | 7.35 | -3.4% |
| 5 | Shandong | 5.30 | -2.1% |
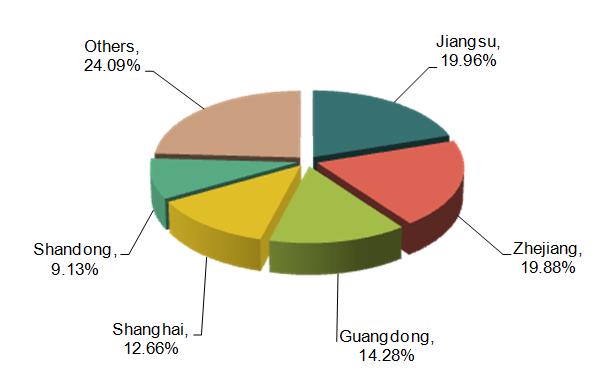
As can be seen from the above chart, Chinese major export sources of tanning, tannins, dyes, paints, inks were Jiangsu, Zhejiang and Guangdong from Jan. to Dec. 2013. The export value of the three provinces respectively accounted for 19.96%, 19.88% and 14.28% of Chinese total export value of these products. Chinese export sources of tanning, tannins, dyes, paints, inks were relatively dispersed.
2013 Jan.-Dec. Chinese Export Enterprises Distribution of Protein Substances (by Export Value)
| No. | Regions | Export Value (Billion Dollars) | Year on Year |
| 1 | Guangdong | 5.43 | 6.3% |
| 2 | Shandong | 5.31 | 23% |
| 3 | Zhejiang | 3.09 | 6% |
| 4 | Jiangsu | 2.96 | 15.6% |
| 5 | Shanghai | 2.31 | -2.1% |
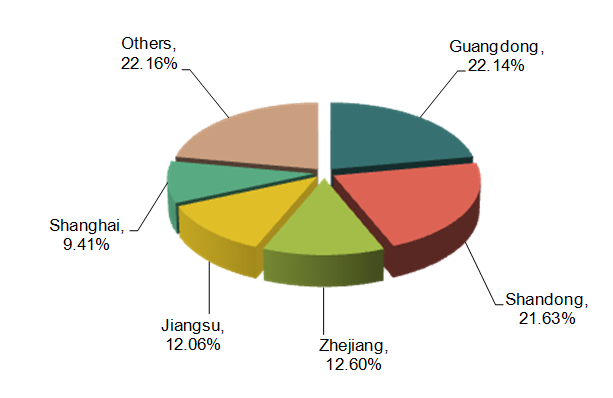
As can be seen from the above chart, Chinese major export sources of protein substances were Guangdong, Shandong and Zhejiang from Jan. to Dec. 2013. Among them, the export value of Guangdong and Shandong respectively accounted for 22.14% and 21.63% of Chinese total export value of protein substances.
2013 Jan.-Dec. Chinese Export Enterprises Distribution of Explosives; Pyrotechnic Products; Pyrophoric Alloys; Combustible Materials (by Export Value)
| No. | Regions | Export Value (Billion Dollars) | Year on Year |
| 1 | Hunan | 5.49 | 3.4% |
| 2 | Jiangxi | 1.71 | 21.3% |
| 3 | Guangxi Zhuang Autonomous Region | 0.58 | 3% |
| 4 | Shandong | 0.54 | -0.6% |
| 5 | Yunnan | 0.13 | 64.8% |
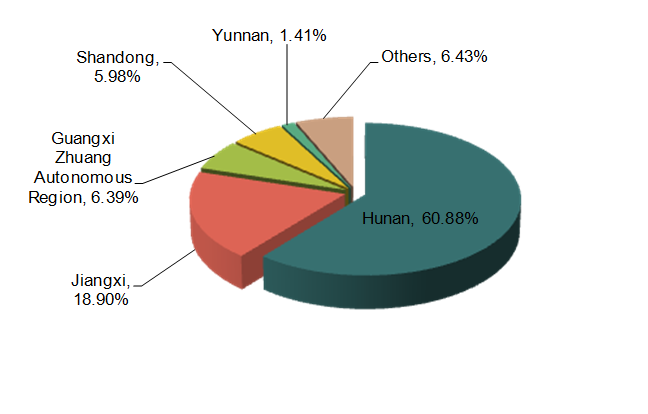
As can be seen from the above chart, Chinese major export sources of explosives; pyrotechnic products; pyrophoric alloys; combustible materials were Hunan, Jiangxi and Guangxi from Jan. to Dec. 2013. Among them, Hunan's export value accounted for more than 60% of Chinese total export value of explosives; pyrotechnic products; pyrophoric alloys; combustible materials. The export sources were concentrated.
2013 Jan.-Dec. Chinese Export Enterprises Distribution of Photographic and Film Products (by Export Value)
| No. | Regions | Export Value (Billion Dollars) | Year on Year |
| 1 | Guangdong | 3.04 | -5.9% |
| 2 | Jiangsu | 2.44 | 5.8% |
| 3 | Fujian | 2.09 | 0.6% |
| 4 | Shanghai | 1.11 | 14.6% |
| 5 | Henan | 1.00 | 10.3% |
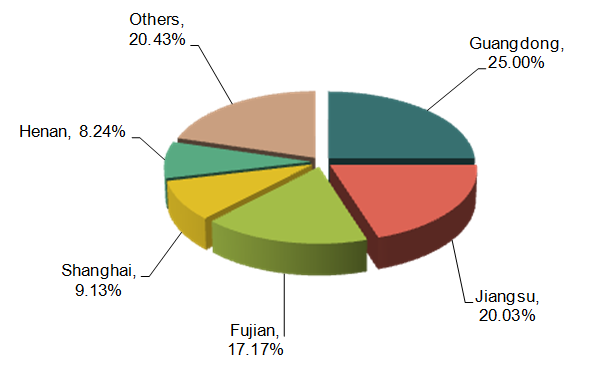
As can be seen from the above chart, Chinese major export sources of photographic and film products were Guangdong, Jiangsu and Fujian from Jan. to Dec. 2013. Among them, Guangdong's export value accounted for 1/4 of Chinese total export value of photographic and film products.
2013 Jan.-Dec. Chinese Export Enterprises Distribution of Miscellaneous Chemical Products (by Export Value)
| No. | Regions | Export Value (Billion Dollars) | Year on Year |
| 1 | Jiangsu | 31.00 | 16.2% |
| 2 | Zhejiang | 15.47 | 17.6% |
| 3 | Shandong | 14.90 | 22.3% |
| 4 | Guangdong | 9.79 | 2.6% |
| 5 | Shanghai | 9.05 | 5% |
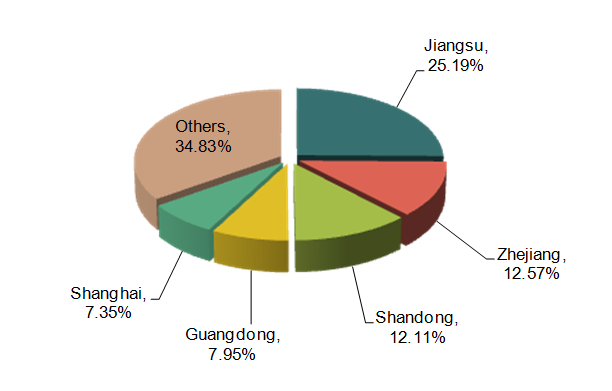
As can be seen from the above chart, Chinese major export sources of miscellaneous chemical products were Jiangsu, Zhejiang and Shandong from Jan. to Dec. 2013. Among them, Jiangsu's export value accounted for 25.19% of Chinese total export value of miscellaneous chemical products.
2013 Jan.-Dec. Chinese Export Enterprises Distribution of Plastics and Articles Thereof (by Export Value)
| No. | Regions | Export Value (Billion Dollars) | Year on Year |
| 1 | Guangdong | 222.31 | 22.2% |
| 2 | Zhejiang | 118.89 | 16.2% |
| 3 | Jiangsu | 94.93 | 9.1% |
| 4 | Shanghai | 51.59 | 4.9% |
| 5 | Shandong | 35.97 | 10% |
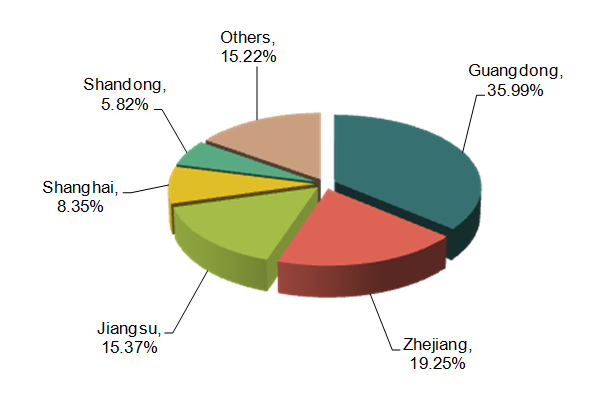
As can be seen from the above chart, Chinese major export sources of plastics and articles thereof were Guangdong, Zhejiang and Jiangsu from Jan. to Dec. 2013. The export value of the above three provinces respectively accounted for 35.99%, 19.25% and 15.37% of Chinese total export value of plastics and articles thereof, totally accounted for 70%.
2013 Jan.-Dec. Chinese Export Enterprises Distribution of Rubber and Articles Thereof (by Export Value)
| No. | Regions | Export Value (Billion Dollars) | Year on Year |
| 1 | Shandong | 96.84 | 4.2% |
| 2 | Jiangsu | 26.01 | -1.3% |
| 3 | Zhejiang | 24.51 | 2% |
| 4 | Guangdong | 21.18 | 32.1% |
| 5 | Shanghai | 10.48 | -9.4% |
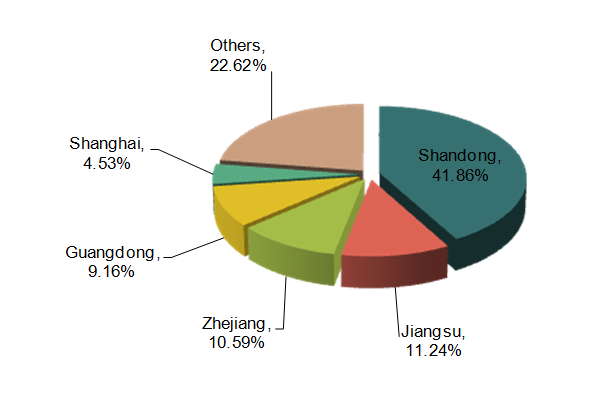
As can be seen from the above chart, Chinese major export sources of rubber and articles thereof were Shandong, Jiangsu and Zhejiang from Jan. to Dec. 2013. Among them, Shandong's export value accounted for over 40% of Chinese total export value of rubber and articles thereof.
Source: China Customs


