Export Quantity & Value for Chinese Artificial Flowers & Wigs(HS: 67)from Jan. to June in 2013
| Month | Quantity (KG) | Value (USD) | Year on Year | |
| Quantity | Value | |||
| Jan. | 27,746,008 | 460,110,987 | 2.3% | 30.5% |
| Feb. | 18,384,002 | 330,664,987 | 62.9% | 101.9% |
| March | 15,101,621 | 330,192,497 | -26% | -7.1% |
| April | 20,538,537 | 399,747,219 | -5.8% | -6.5% |
| May | 24,253,657 | 472,653,456 | -6.2% | -11.3% |
| June | 25,217,194 | 522,304,781 | -6.1% | -1.9% |
| Total | 131,241,019 | 2,515,673,927 | -1.6% | 6.4% |
The total export value for Chinese artificial flowers & wigs from Jan. to June in 2013 achieved 2.516 billion USD, and increased 6.4% year on year.
Major Countries/Regions for Chinese Artificial Flowers & Wigs(HS: 67)Export from Jan. to June in 2013
| No. | Countries/Regions | Quantity (KG) | Value (USD) | Year on Year | |
| Quantity | Value | ||||
| 1 | USA | 26,350,056 | 900,575,233 | -12.2% | -4.4% |
| 2 | Benin | 1,584,880 | 128,916,523 | -19.6% | -6.3% |
| 3 | Nigeria | 2,397,859 | 104,454,192 | -23.5% | 18.3% |
| 4 | Hong Kong | 8,132,216 | 100,150,558 | -15.3% | 43.5% |
| 5 | Germany | 4,839,132 | 90,909,872 | -8.4% | -8.2% |
| 6 | South Africa | 2,471,884 | 88,695,205 | 24.5% | 38.4% |
| 7 | United Kingdom | 2,775,600 | 81,108,327 | -3.3% | -4.2% |
| 8 | Japan | 2,990,917 | 78,188,808 | -1.9% | -1.7% |
| 9 | Netherlands | 3,380,466 | 65,699,852 | 23.2% | 37.6% |
| 10 | France | 2,469,023 | 46,224,933 | -2.9% | 11.5% |
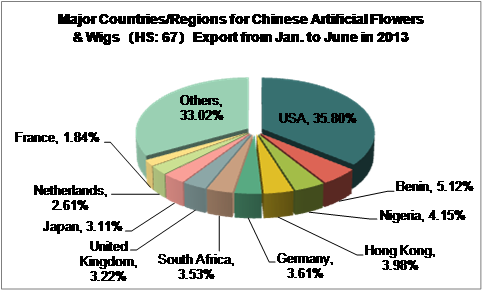
For export quantity from Jan. to June in 2013 South Africa ranked first of the top 10 countries/regions and increased 24.5% year on year. For export value Hong Kong ranked first and increased 43.5% year on year.
Source: Customs Information Network


