| HS Code | Product Name |
| 901890 | Instruments and appliances used in medical, surgical, dental or veterinary sciences |
| 901910 | Mechano-therapy appliances; massage apparatus, psychological aptitude-testing apparatus |
South Korea Beauty Equipment Industry Import Situation from 2010 to 2012
South Korea Instruments and Appliances Used in Medical, Surgical, Dental or Veterinary Sciences (HS: 901890) Import Situation from 2010 to 2012
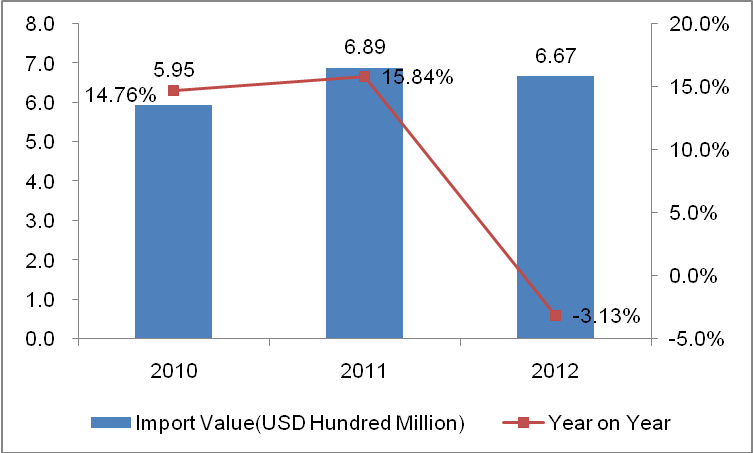
South Korea Instruments and Appliances Used in Medical, Surgical, Dental or Veterinary Sciences Import Value Annual Trend from 2010 to 2012

South Korea Instruments and Appliances Used in Medical, Surgical, Dental or Veterinary Sciences import value trend was inverted "V" type from 2010 to 2012. The import value of the three years amounted to 595 million dollars (with an increase of 14.76%), 689 million dollars (with an increase of 15.84%) and 667 million dollars (with a decrease of 3.13%).
South Korea Instruments and Appliances Used in Medical, Surgical, Dental or Veterinary Sciences Main Source Country/Region from 2010 to 2012
(Unit: Thousand US dollars)
| Country / Region | 2010 | 2011 | 2012 |
| USA | 258,400 | 260,868 | 231,297 |
| Japan | 85,669 | 108,314 | 114,849 |
| Germany | 102,869 | 117,567 | 109,079 |
| Mexico | 23,007 | 41,525 | 52,188 |
| China | 26,613 | 29,889 | 33,720 |
| Italy | 12,109 | 21,145 | 18,433 |
| Switzerland | 10,815 | 15,403 | 15,029 |
| Israel | 8,753 | 17,701 | 11,373 |
| France | 9,459 | 9,530 | 9,558 |
| Austria | 6,852 | 8,135 | 8,537 |
| India | 8,324 | 7,268 | 7,298 |
| Dominican | 770 | 826 | 6,731 |
| UK | 7,871 | 8,896 | 5,927 |
| Sweden | 7,908 | 5,923 | 5,076 |
| Costa Rica | 849 | 3,229 | 4,666 |
| Ireland | 2,303 | 2,248 | 3,667 |
| Hungary | 304 | 1,278 | 3,493 |
| Singapore | 3,133 | 2,508 | 2,981 |
| Netherlands | 3,118 | 3,892 | 2,767 |
| Pakistan | 2,004 | 2,293 | 2,711 |
South Korea Instruments and Appliances Used in Medical, Surgical, Dental or Veterinary Sciences Main Source Country/Region Market Share Trend from 2010 to 2012
| Country / Region | 2010 | 2011 | 2012 |
| USA↓ | 43.45% | 37.86% | 34.65% |
| Japan↑ | 14.40% | 15.72% | 17.21% |
| Germany↓ | 17.30% | 17.06% | 16.34% |
| Mexico↑ | 3.87% | 6.03% | 7.82% |
| China | 4.47% | 4.34% | 5.05% |
| Italy | 2.04% | 3.07% | 2.76% |
| Switzerland↑ | 1.82% | 2.24% | 2.25% |
| Israel | 1.47% | 2.57% | 1.70% |
| France | 1.59% | 1.38% | 1.43% |
| Austria↑ | 1.15% | 1.18% | 1.28% |
| India | 1.40% | 1.05% | 1.09% |
| Dominican | 0.13% | 0.12% | 1.01% |
| UK↓ | 1.32% | 1.29% | 0.89% |
| Sweden↓ | 1.33% | 0.86% | 0.76% |
| Costa Rica↑ | 0.14% | 0.47% | 0.70% |
| Ireland | 0.39% | 0.33% | 0.55% |
| Hungary↑ | 0.05% | 0.19% | 0.52% |
| Singapore | 0.53% | 0.36% | 0.45% |
| Netherlands | 0.52% | 0.56% | 0.41% |
| Pakistan | 0.34% | 0.33% | 0.41% |
Note: ↑represents that the indicators listed continued to increase from 2010 to 2012, ↓represents that the indicators listed continued to decrease from 2010 to 2012.
South Korea Instruments and Appliances Used in Medical, Surgical, Dental or Veterinary Sciences main import source countries are USA, Japan, Germany, Mexico, China, Italy, Switzerland, Israel, France and Austria and so on. China ranked the fifth and South Korea import value of Instruments and Appliances Used in Medical, Surgical, Dental or Veterinary Sciences from China accounted for 5.05% of the total import value of the products in 2012.
South Korea Mechano-therapy Appliances; Massage Apparatus, Psychological Aptitude-Testing Apparatus (HS: 901910) Import Situation from 2010 to 2012
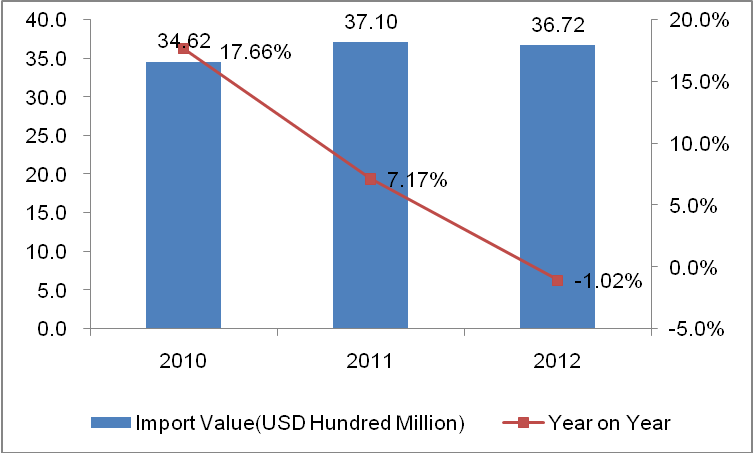
South Korea Mechano-therapy Appliances; Massage Apparatus, Psychological Aptitude-Testing Apparatus Import Value Annual Trend from 2010 to 2012

The import value of South Korea Mechano-therapy Appliances; Massage Apparatus, Psychological Aptitude-Testing Apparatus amounted to 3.462 billion US dollars (with an increase of 17.66%), 3.71 billion US dollars (with an increase of 7.17%) and 3.672 billion US dollars (with a decrease of 1.02%) from 2010 to 2012.
South Korea Mechano-therapy Appliances; Massage Apparatus, Psychological Aptitude-Testing Apparatus Main Source Country/Region from 2010 to 2012
(Unit: Thousand US dollars)
| Country / Region | 2010 | 2011 | 2012 |
| USA | 559,978 | 650,975 | 684,592 |
| Japan | 339,070 | 397,575 | 383,014 |
| Canada | 209,258 | 217,400 | 215,212 |
| Germany | 200,414 | 210,510 | 186,199 |
| France | 201,942 | 178,957 | 175,018 |
| The Russian Federation | 133,121 | 148,803 | 171,777 |
| UK | 142,674 | 145,712 | 147,838 |
| Hong Kong | 116,052 | 120,771 | 141,980 |
| Netherlands | 106,864 | 125,440 | 129,206 |
| Republic of Korea | 75,296 | 90,443 | 105,025 |
| Belgium | 84,812 | 87,270 | 84,576 |
| Taiwan | 67,413 | 72,578 | 83,337 |
| Australia | 60,690 | 69,654 | 80,552 |
| Malaysia | 57,545 | 70,357 | 71,264 |
| Switzerland | 58,154 | 63,846 | 59,167 |
| China | 43,791 | 54,908 | 56,170 |
| Singapore | 39,613 | 44,423 | 55,741 |
| Italy | 90,864 | 79,302 | 51,882 |
| Austria | 52,286 | 52,607 | 51,120 |
| Poland | 60,057 | 58,923 | 50,851 |
South Korea Mechano-therapy Appliances; Massage Apparatus, Psychological Aptitude-Testing Apparatus Main Source Country/Region Market Share Trend from 2010 to 2012
| Country / Region | 2010 | 2011 | 2012 |
| USA↑ | 16.17% | 17.55% | 18.64% |
| Japan | 9.79% | 10.72% | 10.43% |
| Canada | 6.04% | 5.86% | 5.86% |
| Germany↓ | 5.79% | 5.67% | 5.07% |
| France↓ | 5.83% | 4.82% | 4.77% |
| The Russian Federation↑ | 3.85% | 4.01% | 4.68% |
| UK | 4.12% | 3.93% | 4.03% |
| Hong Kong | 3.35% | 3.26% | 3.87% |
| Netherlands↑ | 3.09% | 3.38% | 3.52% |
| Republic of Korea↑ | 2.17% | 2.44% | 2.86% |
| Belgium↓ | 2.45% | 2.35% | 2.30% |
| Taiwan↑ | 1.95% | 1.96% | 2.27% |
| Australia↑ | 1.75% | 1.88% | 2.19% |
| Malaysia↑ | 1.66% | 1.90% | 1.94% |
| Switzerland | 1.68% | 1.72% | 1.61% |
| China↑ | 1.26% | 1.48% | 1.53% |
| Singapore↑ | 1.14% | 1.20% | 1.52% |
| Italy↓ | 2.62% | 2.14% | 1.41% |
| Austria↓ | 1.51% | 1.42% | 1.39% |
| Poland↓ | 1.73% | 1.59% | 1.38% |
Note: ↑represents that the indicators listed continued to increase from 2010 to 2012, ↓represents that the indicators listed continued to decrease from 2010 to 2012.
South Korea Mechano-therapy Appliances; Massage Apparatus, Psychological Aptitude-Testing Apparatus main import source countries are USA, Japan, Canada, Germany, France, The Russian Federation, UK, Hong Kong, Netherlands and South Korea and so on. China ranked the sixteenth.South Korea Beauty Equipment Industry Export Situation from 2010 to 2012
South Korea Instruments and Appliances Used in Medical, Surgical, Dental or Veterinary Sciences (HS: 901890) Export Situation from 2010 to 2012
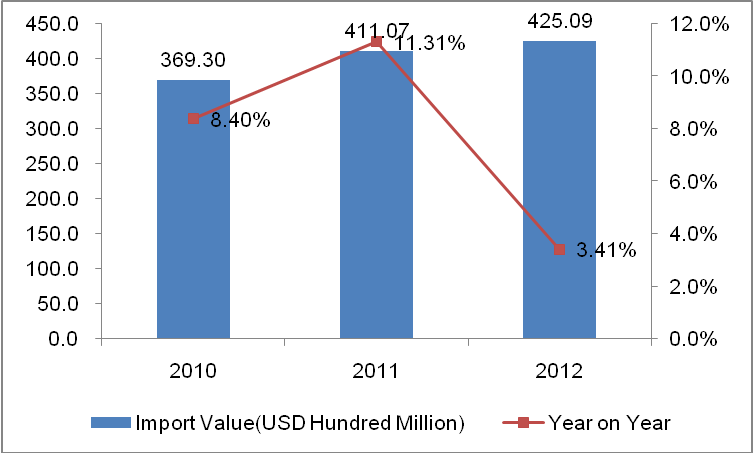
South Korea Instruments and Appliances Used in Medical, Surgical, Dental or Veterinary Sciences Export Value Annual Trend from 2010 to 2012

The export value of South Korea Instruments and Appliances Used in Medical, Surgical, Dental or Veterinary Sciences increased year by year from 2010 to 2012. The export value of the three years amounted to 36.93 billion US dollars (with an increase of 8.4%), 41.11 billion US dollars (with an increase of 11.31%) and 42.51 billion US dollars (with an increase of 3.41%).
South Korea Instruments and Appliances Used in Medical, Surgical, Dental or Veterinary Sciences Main Export Destination Country/Region from 2010 to 2012
(Unit: Thousand US dollars)
| Country / Region | 2010 | 2011 | 2012 |
| USA | 9,681,328 | 10,380,945 | 10,744,219 |
| Germany | 5,136,492 | 5,832,001 | 5,826,429 |
| Belgium | 2,159,376 | 2,503,968 | 2,658,379 |
| Netherlands | 1,647,753 | 2,233,649 | 2,175,561 |
| Singapore | 1,135,319 | 1,536,736 | 2,141,893 |
| Mexico | 2,029,606 | 2,038,747 | 1,996,830 |
| France | 1,797,230 | 1,851,577 | 1,691,708 |
| Switzerland | 1,146,508 | 1,442,876 | 1,361,137 |
| Ireland | 1,130,225 | 1,509,868 | 1,334,372 |
| Japan | 1,132,962 | 1,166,966 | 1,228,417 |
| China | 1,062,223 | 1,104,995 | 1,184,891 |
| UK | 1,153,424 | 1,137,749 | 1,089,547 |
| Italy | 1,080,900 | 1,094,433 | 975,027 |
| Finland | 612,540 | 630,557 | 756,162 |
| Dominican | 582,815 | 588,129 | 636,869 |
| Sweden | 572,388 | 552,015 | 563,608 |
| Israel | 404,954 | 480,129 | 530,164 |
| Costa Rica | 194,953 | 261,302 | 406,057 |
| Republic of Korea | 279,785 | 329,861 | 382,420 |
| Thailand | 262,570 | 330,885 | 344,804 |
South Korea Instruments and Appliances Used in Medical, Surgical, Dental or Veterinary Sciences Main Export Destination Country/Region Market Share Trend from 2010 to 2012South Korea Instruments and Appliances Used in Medical, Surgical, Dental or Veterinary Sciences Main Export Destination Country/Region Market Share Trend from 2010 to 2012
| Country / Region | 2010 | 2011 | 2012 |
| USA | 26.22% | 25.25% | 25.27% |
| Germany | 13.91% | 14.19% | 13.71% |
| Belgium↑ | 5.85% | 6.09% | 6.25% |
| Netherlands | 4.46% | 5.43% | 5.12% |
| Singapore↑ | 3.07% | 3.74% | 5.04% |
| Mexico↓ | 5.50% | 4.96% | 4.70% |
| France↓ | 4.87% | 4.50% | 3.98% |
| Switzerland | 3.10% | 3.51% | 3.20% |
| Ireland | 3.06% | 3.67% | 3.14% |
| Japan | 3.07% | 2.84% | 2.89% |
| China | 2.88% | 2.69% | 2.79% |
| UK↓ | 3.12% | 2.77% | 2.56% |
| Italy↓ | 2.93% | 2.66% | 2.29% |
| Finland | 1.66% | 1.53% | 1.78% |
| Dominican | 1.58% | 1.43% | 1.50% |
| Sweden↓ | 1.55% | 1.34% | 1.33% |
| Israel↑ | 1.10% | 1.17% | 1.25% |
| Costa Rica↑ | 0.53% | 0.64% | 0.96% |
| Republic of Korea↑ | 0.76% | 0.80% | 0.90% |
| Thailand↑ | 0.71% | 0.80% | 0.81% |
Note: ↑represents that the indicators listed continued to increase from 2010 to 2012, ↓represents that the indicators listed continued to decrease from 2010 to 2012.
South Korea Instruments and Appliances Used in Medical, Surgical, Dental or Veterinary Sciences mainly exported to USA, Germany, Belgium, Netherlands, Singapore, Mexico, France, Switzerland, Ireland and Japan and so on.
South Korea Mechano-therapy Appliances; Massage Apparatus, Psychological Aptitude-Testing Apparatus (HS: 901910) Export Situation from 2010 to 2012
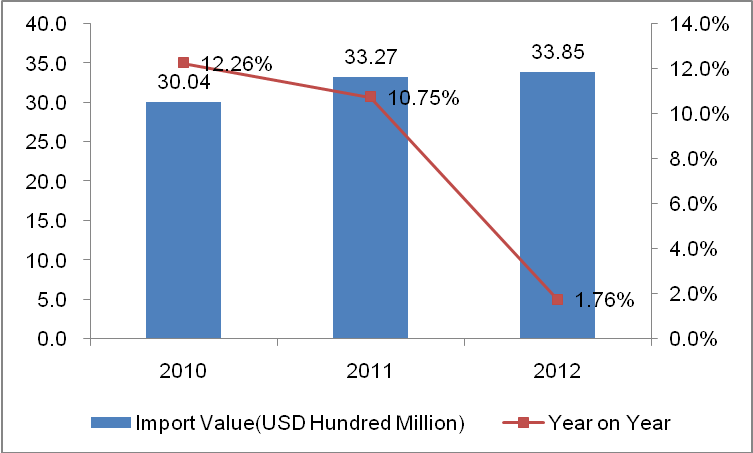
South Korea Mechano-therapy Appliances; Massage Apparatus, Psychological Aptitude-Testing Apparatus Export Value Annual Trend from 2010 to 2012

The import value of South Korea Mechano-therapy Appliances; Massage Apparatus, Psychological Aptitude-Testing Apparatus increased year by year from 2010 to 2012. The import value of the three years amounted to 3.004 billion US dollars (with an increase of 12.26%), 3.327 billion US dollars (with an increase of 10.75%) and 3.385 billion US dollars (with an increase of 1.76%).
South Korea Mechano-therapy Appliances; Massage Apparatus, Psychological Aptitude-Testing Apparatus Main Export Destination Country/Region from 2010 to 2012
(Unit: Thousand US dollars)
| Country / Region | 2010 | 2011 | 2012 |
| China | 1,167,028 | 1,343,684 | 1,450,573 |
| USA | 335,651 | 359,955 | 368,301 |
| Germany | 204,033 | 213,541 | 201,338 |
| Netherlands | 97,318 | 180,888 | 170,137 |
| Mexico | 96,178 | 149,206 | 161,104 |
| Hong Kong | 147,224 | 145,270 | 139,164 |
| Canada | 99,618 | 106,204 | 96,480 |
| Belgium | 70,678 | 68,269 | 74,786 |
| France | 82,382 | 81,067 | 71,244 |
| Japan | 80,412 | 77,324 | 64,444 |
| Italy | 84,582 | 80,650 | 62,842 |
| Austria | 55,814 | 54,140 | 53,075 |
| Singapore | 44,817 | 31,013 | 49,865 |
| Spain | 57,150 | 61,207 | 45,295 |
| Taiwan | 43,282 | 40,104 | 44,804 |
| Republic of Korea | 40,396 | 41,151 | 42,671 |
| Switzerland | 40,712 | 46,980 | 37,324 |
| UK | 36,360 | 41,829 | 36,441 |
| Israel | 21,177 | 26,963 | 28,042 |
| Czech | 20,969 | 19,617 | 22,454 |
South Korea Mechano-therapy Appliances; Massage Apparatus, Psychological Aptitude-Testing Apparatus Main Export Destination Country/Region Market Share Trend from 2010 to 2012
| Country / Region | 2010 | 2011 | 2012 |
| China↑ | 38.85% | 40.39% | 42.85% |
| USA | 11.17% | 10.82% | 10.88% |
| Germany↓ | 6.79% | 6.42% | 5.95% |
| Netherlands | 3.24% | 5.44% | 5.03% |
| Mexico↑ | 3.20% | 4.48% | 4.76% |
| Hong Kong↓ | 4.90% | 4.37% | 4.11% |
| Canada↓ | 3.32% | 3.19% | 2.85% |
| Belgium | 2.35% | 2.05% | 2.21% |
| France↓ | 2.74% | 2.44% | 2.10% |
| Japan↓ | 2.68% | 2.32% | 1.90% |
| Italy↓ | 2.82% | 2.42% | 1.86% |
| Austria↓ | 1.86% | 1.63% | 1.57% |
| Singapore | 1.49% | 0.93% | 1.47% |
| Spain↓ | 1.90% | 1.84% | 1.34% |
| Taiwan | 1.44% | 1.21% | 1.32% |
| Republic of Korea | 1.34% | 1.24% | 1.26% |
| Switzerland | 1.36% | 1.41% | 1.10% |
| UK | 1.21% | 1.26% | 1.08% |
| Israel↑ | 0.70% | 0.81% | 0.83% |
| Czech | 0.70% | 0.59% | 0.66% |
Note: ↑represents that the indicators listed continued to increase from 2010 to 2012, ↓represents that the indicators listed continued to decrease from 2010 to 2012.
South Korea Mechano-therapy Appliances; Massage Apparatus, Psychological Aptitude-Testing Apparatus main export to China, USA, Germany, Netherlands, Mexico, Hong Kong, Canada, Belgium, France and Japan, and so on. China is the largest export market of South Korea, South Korea export value of the products to China accounted for 42.85% of the total export value in 2012.
(Source: UN COMTRADE)


