Jan.-Dec. 2012 Chinese Ceramic Sanitary Ware (HS:6910)Export Quantity and Amount
| Month | Quantity(KG) | Amount(USD) | Compared With Last Year | |
| Quantity | Amount | |||
| Jan. | 78,519,778 | 71,101,710 | -7.7% | -2.4% |
| Feb. | 43,054,353 | 42,832,228 | 3% | 18.1% |
| Mar. | 67,127,877 | 67,983,951 | 8.9% | 20.5% |
| Apr. | 73,718,333 | 70,090,580 | -5.3% | 2.6% |
| May | 81,459,576 | 79,341,269 | -2.3% | 10.2% |
| June | 83,809,933 | 80,859,151 | -7.5% | 5% |
| July | 82,260,997 | 78,401,718 | -10.3% | -2.2% |
| Aug. | 86,900,272 | 84,524,543 | 1.1% | 11.4% |
| Sep. | 82,855,502 | 85,046,022 | -1.8% | 13.6% |
| Oct. | 78,395,687 | 83,728,925 | -2% | 17.3% |
| Nov. | 80,031,657 | 93,414,844 | -4.5% | 23.7% |
| Dec. | 80,727,705 | 96,332,864 | -12.5% | 13.4% |
| Total Jan.-Dec. | 918,861,670 | 933,657,805 | -4.1% | 10.4% |
From January to December 2012, the cumulative export quantity of ceramic sanitary ware reached about 91,900 tons; also the exports amounted to $ 930 million. The export volume fell 4.1% and export value increased by 10.4%.
2.2. Jan. – Dec. 2012 Chinese Ceramic Sanitary Ware(HS:6910) Major Export Countries & Regions
| Item | Country | Quantity(KG) | Amount(USD) | Compared With Last Year | |
| Quantity | Amount | ||||
| 1 | The USA | 248,817,062 | 263,413,150 | 12.6% | 16.8% |
| 2 | South Korea | 93,962,239 | 81,622,024 | -9.7% | 6.4% |
| 3 | Canada | 45,429,191 | 56,098,418 | 18.3% | 27.7% |
| 4 | The Philippines | 37,279,745 | 37,659,046 | 34.6% | 169.6% |
| 5 | The United Kingdom | 30,984,306 | 36,260,673 | -23.1% | -12.2% |
| 6 | Australia | 22,235,815 | 34,954,726 | -1.2% | 3.6% |
| 7 | India | 20,049,907 | 22,388,617 | -20% | -3.3% |
| 8 | Singapore | 25,483,981 | 20,860,933 | 3.2% | 60.4% |
| 9 | Saudi Arabia | 22,368,982 | 17,664,059 | 8.1% | 12.6% |
| 10 | Malaysia | 8,271,724 | 17,596,640 | -2.9% | 108% |
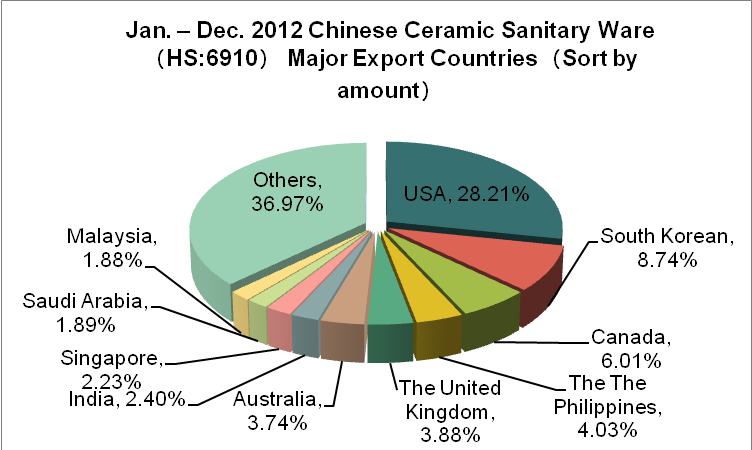
From January to December 2012, according to the top ten ceramic sanitary ware importing countries, the export volume of five countries is increasing; the export volume of other five countries is decreasing. From the data of the export volume, there is a large increase in the Philippines (up 34.6%), a big margin decline in the United Kingdom (down 23.1%). From the exports data, there is a large increase in the Philippines (up 169.6%), Singapore (up 60.4%) and Malaysia (up 108%). It is noteworthy that the Philippines have among the first 14 to 4 from 2011 to 2012, which become China's top ten ceramic sanitary importing countries.
Jan. – Dec. 2012 Chinese Ceramic Sanitary Ware(HS:6910)Exporting Enterprises Distribution
| Item | Region | Quantity(KG) | Amount(USD) | Compared With Last Year | |
| Quantity | Amount | ||||
| 1 | Guangdong | 369,783,387 | 358,442,367 | -15.7% | 10.2% |
| 2 | Hebei | 305,766,263 | 307,870,066 | 5% | 11.8% |
| 3 | Fujian | 76,551,244 | 72,829,574 | 16.2% | 18.6% |
| 4 | Shandong | 44,044,613 | 55,031,404 | 6.2% | 21.9% |
| 5 | Henan | 35,400,293 | 27,431,028 | 16.2% | 29.4% |
| 6 | Jiangsu | 12,764,269 | 25,619,748 | -18.8% | -10.6% |
| 7 | Shanghai | 11,617,261 | 24,676,699 | 12.2% | 12.9% |
| 8 | Hubei | 22,955,465 | 14,771,472 | 2.1% | 8.1% |
| 9 | Chongqing | 11,030,783 | 11,840,930 | -16.4% | -18.6% |
| 10 | Beijing | 4,592,248 | 10,192,508 | -41.4% | -27.5% |
| 11 | Tianjin | 4,297,305 | 6,654,284 | 4.1% | -10.2% |
| 12 | Zhejiang | 7,491,616 | 6,535,595 | 21.7% | -0.1% |
| 13 | Hunan | 5,734,530 | 4,043,394 | -7.5% | -15.1% |
| 14 | Sichuan | 1,752,849 | 3,365,572 | 56.1% | 42.7% |
| 15 | Anhui | 1,716,311 | 1,474,672 | 96% | 79.5% |
| 16 | Inner Mongolia Autonomous Region | 2,270,436 | 808,942 | 26.2% | 14.9% |
| 17 | Liaoning | 291,814 | 478,962 | -4.6% | -13% |
| 18 | Shaanxi | 38,729 | 421,455 | -53.3% | 27.4% |
| 19 | Jiangxi | 280,069 | 264,636 | 331.3% | 110.8% |
| 20 | Gansu | 39,720 | 231,189 | -4.8% | 30.5% |
The main export regions of Chinese ceramic sanitary ware are Guangdong, Hebei, Fujian, Shandong and Henan, from January to December 2012, the total export quantity of the five provinces accounted for 90.5% of China's total exports, and the export amount accounted for 88% of China's total exports. Among the top 20 export regions of ceramic sanitary ware, Jiangxi province gains the greatest export volume and export growth, the export volume increased by 331.3% year on year; also the export amount increased by 110.8% year on year.
(Source: China Customs network)


