The Export of Chinese Fresh Apple in 2012
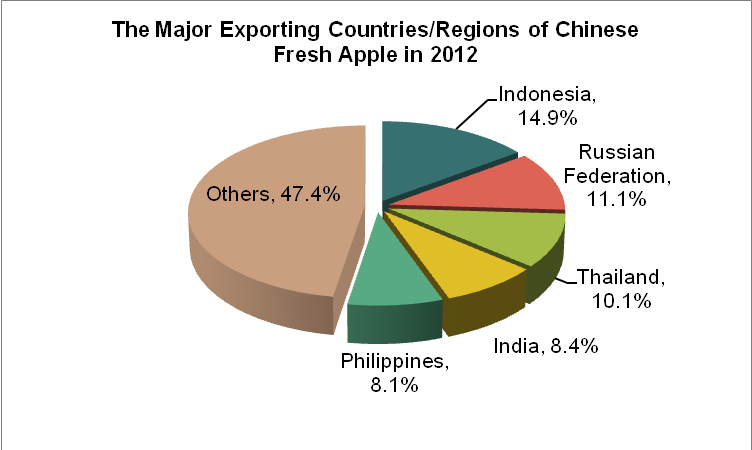
The Major Exporting Countries/Regions of Chinese Fresh Apple in 2012
| Countries/Regions | Quantity(ten thousand tons) | Volume(ten million dollars) | Over the same period last year±% | |
|
|
|
| Quantity | Volume |
| Indonesia | 12.96 | 14.29 | -16.7% | -4.2% |
| Russian Federation | 14.78 | 10.61 | -10.4% | -10.6% |
| Thailand | 8.04 | 9.73 | -9.1% | 1.3% |
| India | 7.26 | 8.05 | 0.4% | 7.3% |
| Philippines | 6.99 | 7.81 | 13.3% | 18.5% |
| Vietnam | 7.64 | 6.94 | -8.6% | 32.3% |
| Kazakhstan | 7.25 | 6.76 | 19.8% | 17.4% |
| Bangladesh | 8.08 | 6.14 | -18.6% | -18.1% |
| United Arab Emirates | 2.94 | 3.60 | -1.6% | 16.2% |
| Malaysia | 2.94 | 3.60 | 1.1% | 18.2% |
Indonesia is the largest exporting market of Chinese fresh apple, accounts for about 14.9%
The data shows that from Jan. to Dec., 2012, China exports fresh apple concentratedly and the top five exporting markets include Indonesia, Russian Federation, Thailand, India and Philippines, which account for 52.6% of the Chinese exporting volume in the field of apple. Among those five countries, Indonesia is our largest exporting market, accounts for about 14.9%; Russian Federation and Thailand go after it and account for 11.1% and 10.1% respectively.
The demand of Philippines and Kazakhstan for Chinese fresh apple increased by 13.3% and 19.8% than that of the same period last year
The exporting quantity of Chinese fresh apple in 2012 decreased by 5.7% than that of the same period in 2011, and the exporting volume increased by 5%.It is noteworthy that among the top ten exporting markets, the export quantity to Philippines and Kazakhstan increased by 13.3% and 19.8% respectively.
The Major Exporting Source and the Average Unit Price of Chinese Fresh Apple in 2012
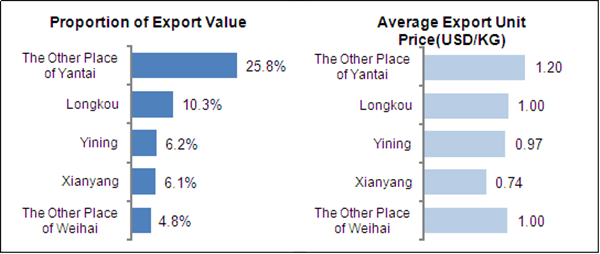
Yantai and Weihai in Shandong province, Yining in Xinjiang province and Xianyang in Shanxi province are the top four exporting sources of Chinese fresh apple. And according to the data, the exporting average unit price of Yantai is the highest and that of Xianyang is the lowest.
The Export of Chinese Orange in 2012
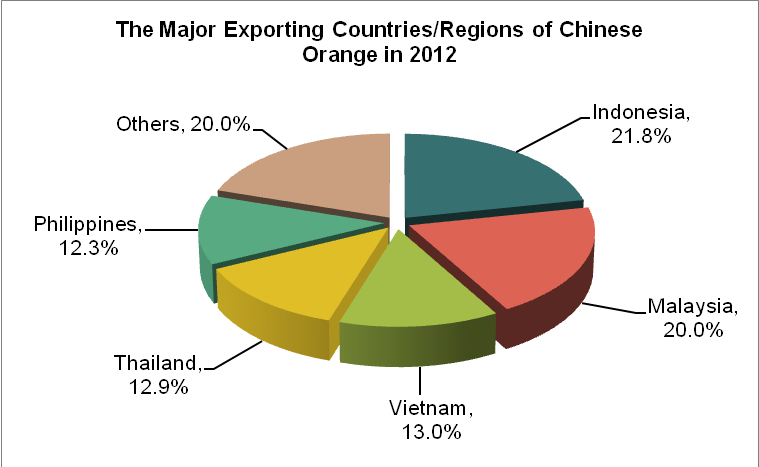
The Major Exporting Countries/Regions of Chinese Orange in 2012
| Countries/Regions | Quantity(ten thousand tons) | Volume(ten million dollars) | Over the same period last year±% | |
|
|
|
| Quantity | Volume |
| Indonesia | 16.76 | 16.28 | -4.2% | 0.9% |
| Malaysia | 10.91 | 14.96 | -3.9% | 23.6% |
| Vietnam | 18.62 | 9.73 | 11.9% | 28.2% |
| Thailand | 7.10 | 9.66 | 40.8% | 56.0% |
| Philippines | 8.57 | 9.21 | 110.0% | 140.1% |
| Russian Federation | 8.68 | 6.14 | 32.8% | 56.1% |
| Canada | 2.57 | 2.13 | -1.5% | -1.9% |
| Kazakhstan | 2.46 | 2.02 | 63.9% | 63.4% |
| Bangladesh | 1.98 | 1.91 | 7.5% | 25.8% |
| Singapore | 0.64 | 0.70 | -37.2% | -36.5% |
Indonesia is the largest exporting market of Chinese orange, accounts for about 21.8%
The data show that from Jan. to Dec., 2012, China exports orange concentratedly and
the top five exporting markets include Indonesia, Malaysia, Vietnam, Thailand and Philippines, which account for 80% of the Chinese exporting volume in the field of citrus products. Among those five countries, Indonesia is our largest exporting market, accounts for about 21.8%; Malaysia and Vietnam go after it and account for 20% and 13% respectively.
The demand of Thailand、Philippines、Russian Federation and Kazakhstan for Chinese orange increase significantly
The exporting quantity of Chinese orange in 2012 increases by 15.6% than that of the same period in 2011, and the exporting volume increases by 30.7%. Among the top ten exporting markets, the export to Philippines increases largest, up 110.0% than that of the same period of 2011; Kazakhstan goes after it, up 63.9%. Meanwhile, the export to Thailand and Russian Federation increase by 40.8% and 32.8% respectively, which is quite significant.
The Major Exporting Source and the Average Unit Price of Chinese Orange in 2012

Quanzhou, Zhangzhou and Xiamen Special Economic Zone in Fujian province, Yunnan province and Guilin in Guangxi province are the top five exporting source of Chinese orange. And according to the data, among the five sourcing cities, the exporting average unit price of Guilin is the lowest, that of Quanzhou, Zhangzhou and Xiamen Special Economic Zone in Fujian province is in the middle, and that of Yunnan province is the highest.
The Export of Chinese Fresh or Frozen Garlic in 2012
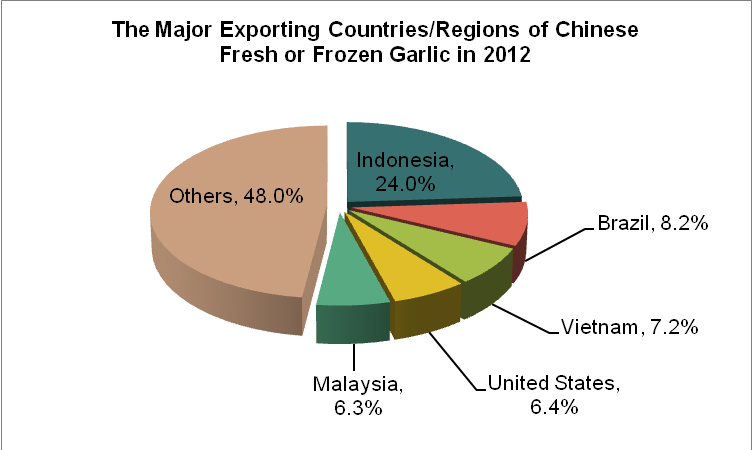
The Major Exporting Countries/Regions of Chinese Fresh or Frozen Garlic in 2012
| Countries/Regions | Quantity(ten thousand tons) | Volume(ten million dollars) | Over the same period last year±% | |
|
|
|
| Quantity | Volume |
| Indonesia | 39.99 | 33.24 | -1.4% | -32.6% |
| Brazil | 9.64 | 11.35 | -11.5% | -20.0% |
| Vietnam | 13.80 | 9.98 | -6.4% | -42.3% |
| USA | 6.34 | 8.89 | -1.3% | -7.3% |
| Malaysia | 8.81 | 8.70 | -2.6% | -26.7% |
| Thailand | 5.18 | 5.79 | -32.0% | -46.4% |
| Philippines | 6.55 | 5.62 | 7.4% | -28.4% |
| Netherlands | 3.36 | 4.53 | -9.4% | -18.6% |
| Japan | 2.25 | 4.52 | -2.7% | -7.9% |
| United Arab Emirates | 3.70 | 3.89 | -19.9% | -32.4% |
Indonesia is the largest exporting market of Chinese fresh or frozen garlic, accounts for about 24%
The data show that from Jan. to Dec., 2012, China exports fresh or frozen garlic concentratedly and the top five exporting markets include Indonesia, Brazil, Vietnam, USA and Malaysia, which account for 52% of the Chinese exporting volume in the field of such products. Among those five countries, Indonesia is our largest exporting market of fresh or frozen garlic, accounts for about 24%; Brazil and Vietnam go after it and account for 8.2% and 7.2% respectively.
The exporting quantity of Chinese fresh or frozen garlic decreases while the price increases in 2012
The exporting quantity of Chinese fresh or frozen garlic in 2012 decreased by 15% than that of the same period in 2011, and the exporting volume decreased by 32.9%.The export to the top ten exporting markets all decreased than that of the same period in 2011.And the export to Thailand decreased by 32%, which is the largest decrease.
The Major Exporting Source and The Average Unit Price of Chinese Fresh or Frozen Garlic in 2012
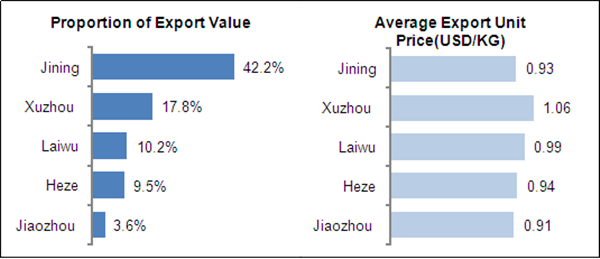
Shandong province is the largest export sourcing of Chinese garlic and among all the cities, Jining, Laiwu, Heze, Jiaozhou are the major exporting ones. Meanwhile, Xuzhou from Jiangsu province is also one of the exporting sources of garlic.
The Export of Chinese Fresh or frozen Onion and Scallion in 2012
The Major Exporting Countries/Regions of Chinese Fresh or Frozen Onion and Scallion in 2012
| Countries/Regions | Quantity(ten thousand tons) | Volume(ten million dollars) | Over the same period last year±% | |
|
|
|
| Quantity | Volume |
| Japan | 28.02 | 15.46 | 1.9% | 25.1% |
| Vietnam | 13 | 6.42 | 16.0% | 42.7% |
| Republic of Korea | 4.48 | 2.12 | 143.3% | 183.6% |
| Russian Federation | 5.01 | 1.52 | -52.7% | -52.3% |
| Thailand | 3.46 | 1.26 | -24.4% | -30.0% |
| Philippines | 2.07 | 0.64 | -9.7% | -29.4% |
| Malaysia | 1.66 | 0.63 | -76.2% | -82.2% |
| Hong Kong | 1.01 | 0.24 | -27.8% | -18.9% |
| Indonesia | 0.51 | 0.21 | -55.9% | -52.7% |
| United Arab Emirates | 0.32 | 0.16 | -69.0% | -61.4% |
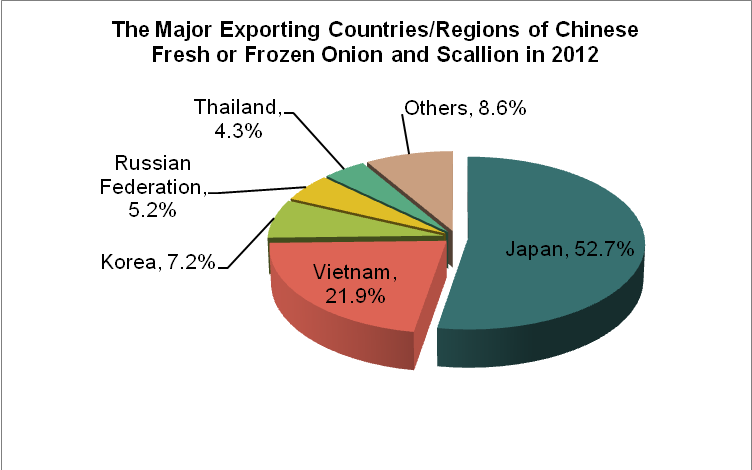
Japan is the largest exporting market of Chinese fresh or frozen onion and scallion, accounts for about 52.7%.
The data show that from Jan. to Dec., 2012, China exports fresh or frozen onion and scallion concentratedly and the top five exporting markets include Japan, Vietnam, Republic of Korea, Russian Federation and Thailand, which account for 91.4% of the Chinese exporting volume in the field of such products. Among those five countries, Japan is our largest exporting market, accounts for about 52.7%; Vietnam goes after it and accounts for 21.9%.
The exporting quantity and price of Chinese fresh or frozen onion and scallion both decrease, while Republic of Korea’s demand increase in 2012
The exporting quantity of Chinese fresh or frozen onion and scallion in 2012 decreases by 16.4% than that of the same period in 2011, and the exporting volume decreases by 2.6%.The export to the top ten exporting markets all decrease than that of the same period in 2011.And the export to Thailand decreases by 32%, which is the largest decrease.
The Major Exporting Source and the Average Unit Price of Chinese Fresh or Frozen Onion and Scallion in 2012

Shandong province and Jiangsu province are the major exporting sources of Chinese fresh or frozen onion and scallion. Weifang, Jining, Qingdao and Zibo from Shandong, Lianyungang from Jiangsu are the major exporting regions. The data show that the average unit price of Zibo is the highest and that of the other regions is almost on the same level.
The Export of Chinese Fresh or Frozen Chili (including Sweet Pepper) in 2012
The Major Exporting Countries/Regions of Chinese Fresh or Frozen Chili (including Sweet Pepper) in 2012
| Countries/Regions | Quantity(ten thousand tons) | Volume(ten million dollars) | Over the same period last year±% | |
|
|
|
| Quantity | Volume |
| Russian Federation | 2.26 | 1.50 | -7.9% | -1.4% |
| Kazakhstan | 0.27 | 0.40 | -47.8% | -42.1% |
| Hong Kong | 1.73 | 0.34 | -52.7% | -54.3% |
| Chinese Taipei | 0.37 | 0.33 | 16.4% | -26.2% |
| Thailand | 0.23 | 0.20 | 84.0% | 7.6% |
| Mongolia | 0.90 | 0.19 | 11.6% | -1.1% |
| Malaysia | 0.22 | 0.18 | -34.8% | -67.0% |
| Singapore | 0.07 | 0.09 | 30.1% | 12.4% |
| Korea | 0.16 | 0.08 | 173.3% | 274.1% |
| Kirghizstan | 0.04 | 0.05 | -43.5% | -28.5% |
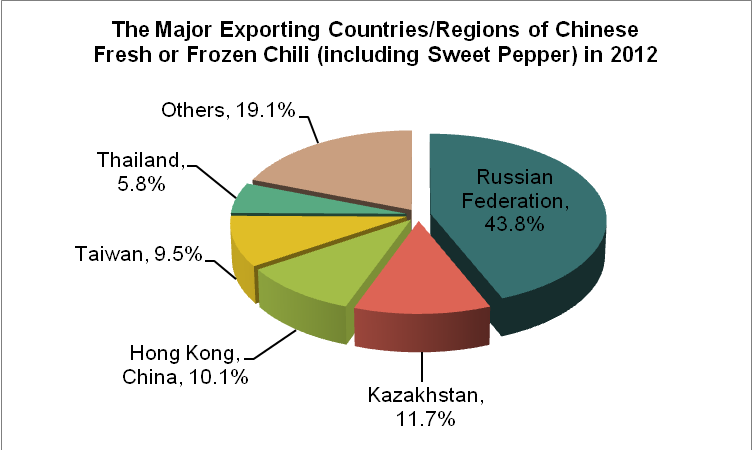
Russian Federation is the largest exporting market of Chinese fresh or frozen chili (including Sweet Pepper), accounts for about 43.8%
The data show that from Jan. to Dec., 2012, China exports fresh or frozen chili (including Sweet Pepper) concentratedly and the top five exporting markets include Russian Federation、Kazakhstan、Hong Kong、Chinese Taipei and Thailand, which account for 80.9% of the Chinese exporting volume in the field of such products. Among those five countries, Russian Federation is our largest exporting market of fresh or frozen chili (including Sweet Pepper), accounts for about 43.8%; Kazakhstan goes after it and accounts for 11.7%.
The exporting quantity of Chinese fresh or frozen chili (including Sweet Pepper) in 2012 decreases by 25%
The exporting quantity of Chinese fresh or frozen chili (including Sweet Pepper) in 2012 decreases by 25% than that of the same period in 2011, and the exporting volume decreases by 25.7%.According to the increase of export, among the top ten exporting markets, the export to five of them increases than that of the period in 2011, and Korea increases largest and Thailand goes after it. The export to Korea and Thailand increase by 173.3% and 84.0% respectively. However, the export to the top three markets all decrease than that of the same period in 2011, and the export to the second and third exporting market ,Kazakhstan and Hong Kong decrease by 47.8% and 52.7% respectively.
The Major Exporting Source and The Average Unit Price of Chinese Fresh or Frozen Chili (including Sweet Pepper) in 2012

The major exporting sources of Chinese fresh or frozen chili (including sweetbell redpepper) concentrate in the following cities: Harbin and Mudanjiang from Heilongjiang province, Jinan and Weifang from Shandong province, and Shenzhen Special Economic Zone from Guangdong province. The data show that the average unit prices are almost at the same level. And the unit price of Weifang is the highest and that of Shenzhen Special Economic Zone is the lowest.


