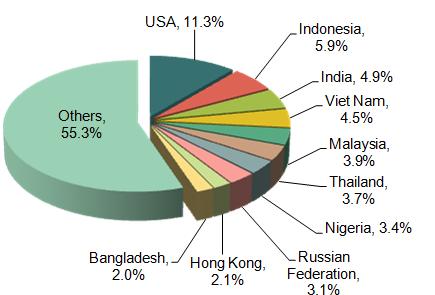
China Bottling or Canning Machinery for Beverages or Liquid Food (HS: 842230) Major Export Countries/Regions from Jan. to Dec. 2014 (by export value)
| No. | Country/Region | Accumulative total from Jan.-Dec. | Accumulatively compared with the same period of last year | ||
| Volume (Set) | Value (USD) | Volume | Value | ||
| 1 | USA | 1,153,372 | 67,804,776 | -22.7% | 7.9% |
| 2 | Indonesia | 186,585 | 35,578,071 | 37.5% | 17.1% |
| 3 | India | 30,478 | 29,307,394 | -6.6% | 14.1% |
| 4 | Viet Nam | 20,092 | 27,057,155 | -10.5% | -63.6% |
| 5 | Malaysia | 110,068 | 23,715,238 | 1.5% | 36.1% |
| 6 | Thailand | 42,372 | 21,992,616 | 36.8% | 2.5% |
| 7 | Nigeria | 41,985 | 20,311,535 | -7.6% | 34% |
| 8 | Russian Federation | 30,090 | 18,703,471 | 5.3% | -15% |
| 9 | Hong Kong | 8,853 | 12,448,289 | 15.2% | 59.2% |
| 10 | Bangladesh | 27,560 | 11,765,608 | 13.2% | 4.5% |
| 11 | Brazil | 10,738 | 11,319,124 | -22.1% | 45.1% |
| 12 | South Africa | 33,947 | 11,205,861 | 27.9% | 1.7% |
| 13 | Germany | 216,386 | 10,746,985 | 113.9% | 135.4% |
| 14 | Australia | 81,228 | 10,513,944 | 83% | -2.3% |
| 15 | Egypt | 26,024 | 10,279,568 | 18.7% | 31% |
| 16 | Canada | 135,183 | 10,260,079 | 44.4% | 21.8% |
| 17 | Japan | 84,180 | 10,149,460 | -18.1% | 36.6% |
| 18 | Saudi Arabia | 8,637 | 10,137,851 | 38.5% | 28.6% |
| 19 | Iran | 13,977 | 9,985,931 | -34.4% | 103.9% |
| 20 | Singapore | 99,656 | 9,927,134 | 899.8% | 129.9% |

Our country's Bottling or canning machinery for beverages or liquid food major export countries/regions are the United States, Indonesia, India, Vietnam, Malaysia, Thailand, Nigeria, the Russian Federation, Hong Kong and Bangladesh and etc. from Jan. to Dec. 2014. The United States is the major export market of our country's Bottling or canning machinery for beverages or liquid food. And the export value to the United States accounted for 11.3% of the total export value of the products. Among China's top twenty export markets in 2014, the export value to Germany, Iran and Singapore increased by 135.4%, 103.9% and 129.9% respectively, which were large increase.
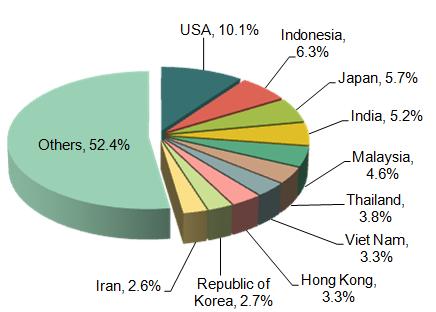
China other Packing or Wrapping Machinery (Including Heatshrink Wrapping Machinery) (HS: 842240) Major Export Countries/Regions from Jan. to Dec. 2014 (by export value)
| No. | Country/Region | Accumulative total from Jan.-Dec. | Accumulatively compared with the same period of last year | ||
| Volume (Set) | Value (USD) | Volume | Value | ||
| 1 | USA | 514,811 | 36,240,720 | 17.9% | 20.5% |
| 2 | Indonesia | 146,779 | 22,507,683 | -7.2% | -9.1% |
| 3 | Japan | 132,122 | 20,318,537 | -14.9% | -3.3% |
| 4 | India | 82,918 | 18,750,887 | 100.3% | 7.8% |
| 5 | Malaysia | 76,023 | 16,606,862 | -43% | -7.3% |
| 6 | Thailand | 45,297 | 13,610,058 | 4.7% | 10.2% |
| 7 | Viet Nam | 15,307 | 11,869,306 | 48.7% | 1.3% |
| 8 | Hong Kong | 13,774 | 11,782,970 | 61% | -39.9% |
| 9 | Republic of Korea | 9,924 | 9,601,602 | -25.1% | 22% |
| 10 | Iran | 28,579 | 9,264,685 | 135.1% | 206.8% |
| 11 | Russian Federation | 31,034 | 8,544,590 | 11.9% | -20.2% |
| 12 | Brazil | 24,602 | 7,826,070 | -15.9% | -42.6% |
| 13 | Nigeria | 13,229 | 7,598,865 | 41.4% | 5.4% |
| 14 | Netherlands | 117,934 | 6,942,467 | -2.8% | 10.8% |
| 15 | Taiwan | 174,208 | 6,912,363 | 709.1% | 63.7% |
| 16 | Germany | 18,169 | 5,919,022 | 30.1% | 63.9% |
| 17 | South Africa | 21,184 | 5,604,532 | 37% | -26.1% |
| 18 | United Kingdom | 20,013 | 5,541,267 | -27.8% | 2.6% |
| 19 | Egypt | 17,235 | 5,371,164 | -7.8% | 95.2% |
| 20 | Philippines | 31,925 | 5,349,356 | 25.3% | -3.3% |

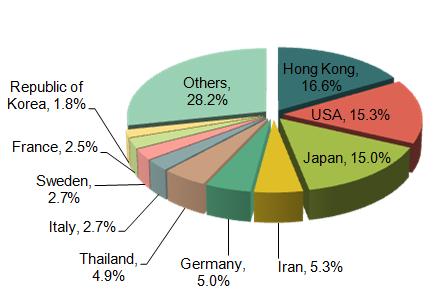
China Parts for 8422 (HS: 842290) Major Export Countries/Regions from Jan. to Dec. 2014 (by export value)
| No. | Country/Region | Accumulative total from Jan.-Dec. | Accumulatively compared with the same period of last year | ||
| Volume (Kg) | Value (USD) | Volume | Value | ||
| 1 | Hong Kong | 1,310,256 | 44,623,114 | 103.5% | 191.2% |
| 2 | USA | 5,791,199 | 40,963,821 | 20% | 14.5% |
| 3 | Japan | 4,118,993 | 40,175,442 | 11.1% | 11.4% |
| 4 | Iran | 2,869,841 | 14,233,555 | 43.8% | 40.8% |
| 5 | Germany | 293,394 | 13,411,832 | 1.6% | 24.7% |
| 6 | Thailand | 820,470 | 13,197,078 | 135.4% | 147.6% |
| 7 | Italy | 493,495 | 7,287,064 | -4.8% | -19.7% |
| 8 | Sweden | 179,861 | 7,137,900 | 26.2% | 19.6% |
| 9 | France | 459,688 | 6,666,175 | 5.7% | -4.1% |
| 10 | Republic of Korea | 544,807 | 4,956,540 | -25.4% | -20.8% |
| 11 | Austria | 150,615 | 4,924,058 | 48.2% | 47.8% |
| 12 | Nigeria | 124,087 | 4,817,842 | -46.2% | 311.8% |
| 13 | Poland | 121,426 | 4,318,178 | 115.5% | 177.9% |
| 14 | Singapore | 319,611 | 3,543,057 | 100.9% | 83.4% |
| 15 | Egypt | 726,543 | 3,532,424 | 50.4% | 47.5% |
| 16 | India | 117,528 | 3,419,204 | -45.5% | 20.8% |
| 17 | Australia | 217,894 | 3,324,218 | 32.2% | 56.3% |
| 18 | Malaysia | 87,879 | 2,973,446 | -55.9% | -18.5% |
| 19 | Netherlands | 172,854 | 2,964,120 | 28.3% | 32.7% |
| 20 | Taiwan | 146,513 | 2,961,986 | -2.2% | 23.3% |

Source: Customs Information Network


