| Name | Unit | Quantity | Amount | Compared the Same Period Last Year | |
|
|
|
|
| Quantity | Amount |
| 847710 injection machine | piece | 17, 874 | 700, 096, 042 | -11.3% | 1.2% |
| 847780 machine for other rubber or plastic | piece | 111, 879 | 623, 713, 525 | 28.1% | 2.2% |
| 847790 the parts listed in 8477 | kg | 84, 638, 328 | 318, 257, 185 | 0% | 6.5% |
| 847720 extruder | piece | 9, 262 | 238, 518, 824 | 20.5% | -6.7% |
| 847730 blow molding machine | piece | 62, 744 | 126, 706, 270 | 534.5% | 13.2% |
| 847759 other mould machine or forming machine | piece | 3, 258 | 104, 554, 112 | 21.4% | 53.9% |
| 847740vacuum molding machine and other hot forming machine | piece | 10, 079 | 90, 336, 845 | 62.1% | 14.8% |
| 847751pneumatic tire molding or tube molding machine | piece | 748 | 41, 872, 826 | -25.9% | 15.7% |
From January to September in 2013, China's injection machine exported amount was the biggest with the proportion of 31.2%. The second is the machine for other rubber or plastic with the proportion of 27.79%. The following are the parts listed in 8477, extruders, blow molding machines, other molding machines, vacuum molding machines and other hot forming machines and Pneumatic tire molding or tube molding machine.
2013 Jan. - Sep. Chinese Plastic Machinery Export Quantity & Amount
| Month | Quantity(-) | Amount(USD) | Compared the Same Period Last Year | |
|
|
|
| Quantity | Amount |
| Jan. | 9, 188, 060 | 265, 782, 746 | 14.3% | -2% |
| Feb. | 6, 428, 592 | 197, 160, 708 | 9.5% | 37% |
| Mar. | 9, 432, 126 | 207, 233, 299 | -6% | -12.7% |
| Apr. | 10, 148, 073 | 229, 548, 374 | 7.1% | 0.0% |
| May | 9, 747, 947 | 247, 107, 180 | -7.1% | -5.6% |
| Jun. | 8, 935, 294 | 268, 263, 297 | -11.3% | 8.2% |
| Jul. | 9, 923, 078 | 274, 487, 036 | -8.6% | 4.4% |
| Aug. | 11, 165, 682 | 283, 167, 397 | 9.8% | 14.9% |
| Sep. | 9, 885, 320 | 271, 305, 592 | 1.1% | 8.4% |
| Jan. - Sep. Total | 84, 854, 172 | 2, 244, 055, 629 | 0.1% | 4.3% |
From January to September in 2013, Chinese plastic machinery Export Value is USD 2244000000,increased 4.3% compared the same period last year.
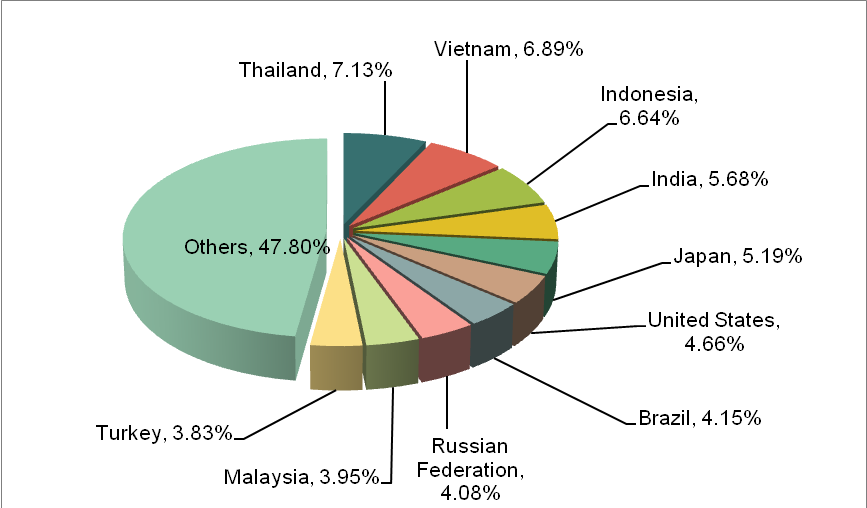
2013 Jan. - Sep. Chinese Plastic Machinery Export Country/ Region
| No. | Country / Region | Quantity(-) | Amount(USD) | Compared the Same Period Last Year | |
|
|
|
|
| Quantity | Amount |
| 1 | Thailand | 1, 529, 839 | 160, 098, 122 | 26.4% | -6% |
| 2 | Vietnam | 2, 557, 725 | 154, 655, 501 | 25.4% | 63% |
| 3 | Indonesia | 1, 432, 017 | 149, 062, 330 | 41.5% | -0.9% |
| 4 | India | 6, 452, 320 | 127, 372, 396 | 34.6% | -9% |
| 5 | Japan | 18, 821, 599 | 116, 469, 843 | 1.4% | 5.6% |
| 6 | United States | 5, 536, 249 | 104, 532, 761 | -8.6% | 4.5% |
| 7 | Brazil | 1, 012, 742 | 93, 172, 672 | -39.8% | -16.2% |
| 8 | Russian Federation | 377, 262 | 91, 497, 515 | -9.3% | 5.2% |
| 9 | Malaysia | 1, 108, 126 | 88, 558, 779 | 45.2% | 64.6% |
| 10 | Turkey | 320, 653 | 85, 995, 156 | 19.5% | -10% |

2013 Jan. - Sep. Chinese plastic machinery Export country/ region are Thailand, Vietnam, Indonesia, India, Japan, United States, Brazil, Russian Federation, Malaysia and Turkey. Thailand is the most imported one with the proportion at 7.13%. Vietnamis the second one with an increase of 63% compared the same period last year. In 2012, the rank of Vietnam is the seventh. The growth of Malaysia is the fastest with an increase of 64.6%.
2013 Jan. - Sep. Chinese Plastic Machinery Export Original Place
| No. | Region | Export Amount(USD) | Proportion |
| 1 | Zhejiang | 686, 174, 194 | 30.58% |
| 2 | Jiangsu | 421, 371, 702 | 18.78% |
| 3 | Guangdong | 395, 000, 057 | 17.60% |
| 4 | Shanghai | 266, 662, 516 | 11.88% |
| 5 | Shandong | 156, 873, 787 | 6.99% |
2013 January to September, Zhejiang Province, Jiangsu Province and Guangdong Province are main Chinese plastics machinery oringinal place with the proprtion of 30.58%, 18.78% and 17.60%, totally 66.96% of total Chinese plastics machinery exports.
Customs Information Network


