2010-2012 Global Tubes, Pipes and Hollow Profiles, Seamless, of Iron or Steel Import Value Trend
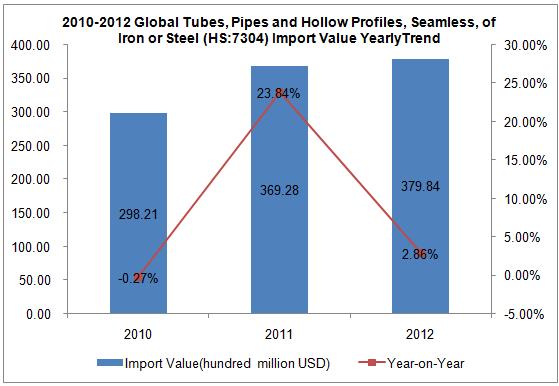
Global Tubes, Pipes and Hollow Profiles, Seamless, of Iron or Steel import value increased YOY from 2010 to 2012, the import value for these three years amounted to 298.21 billion US dollars(decreased 0.27%YOY), 369.28 billion US dollars(increased 23.84% YOY) and 379.84 billion US dollars(increased 2.86% YOY).
2010-2012 Global Tubes, Pipes and Hollow Profiles, Seamless, of Iron or Steel Major Import Countries/Regions
| No. | Import Countries/Regions | Import Value (Thousand USD) | 2012 Import Value Growth compared to 2010 | ||
| 2010 | 2011 | 2012 | |||
| 1 | USA | 3,595,038 | 5,216,829 | 6,286,201 | 74.86% |
| 2 | Republic of Korea | 1,040,465 | 1,550,493 | 1,610,983 | 54.83% |
| 3 | Canada | 1,207,081 | 1,496,208 | 1,531,106 | 26.84% |
| 4 | Indonesia | 1,001,305 | 992,714 | 1,354,770 | 35.30% |
| 5 | United Arab Emirates | 905,979 | 1,350,675 | 1,242,614 | 37.16% |
| 6 | Singapore | 768,091 | 1,004,420 | 1,197,469 | 55.90% |
| 7 | Germany | 959,049 | 1,546,127 | 1,174,208 | 22.43% |
| 8 | China | 1,157,297 | 1,175,327 | 1,144,690 | -1.09% |
| 9 | India | 972,659 | 1,320,665 | 1,121,416 | 15.29% |
| 10 | Russian Federation | 748,624 | 974,322 | 1,054,488 | 40.86% |
| 11 | United Kingdom | 693,427 | 916,225 | 974,308 | 40.51% |
| 12 | Italy | 749,375 | 1,131,586 | 951,214 | 26.93% |
| 13 | Saudi Arabia | 789,210 | 1,099,115 | 773,145 | -2.04% |
| 14 | Malaysia | 302,789 | 595,609 | 743,035 | 145.40% |
| 15 | Thailand | 568,076 | 625,738 | 729,715 | 28.45% |
| 16 | Netherlands | 446,104 | 910,258 | 708,368 | 58.79% |
| 17 | Oman | 371,149 | 377,290 | 701,254 | 88.94% |
| 18 | France | 593,745 | 746,770 | 663,422 | 11.74% |
| 19 | Norway | 287,019 | 569,646 | 659,939 | 129.93% |
| 20 | Venezuela | 366,265 | 484,764 | 638,933 | 74.45% |
From 2010-2012, USA, Republic of Korea and Canada were the first three largest import countries of global Tubes, Pipes and Hollow Profiles, Seamless, of Iron or Steel. Among the top global Tubes, Pipes and Hollow Profiles, Seamless, of Iron or Steel import markets in 2012, the import value of Malaysia Tubes, Pipes and Hollow Profiles, Seamless, of Iron or Steel increased by 145.4% compared to that of 2010, which had the largest increase, followed by Norway, the import value increased by 129.93% compared to that of 2010.
2010-2012 Global Tubes, Pipes and Hollow Profiles, Seamless, of Iron or Steel Major Import Countries/Regions Market Share
| No. | Import Countries/Regions | Import Value Percentage | ||
| 2010 | 2011 | 2012 | ||
| 1 | USA↑ | 12.06% | 14.13% | 16.55% |
| 2 | Republic of Korea↑ | 3.49% | 4.20% | 4.24% |
| 3 | Canada | 4.05% | 4.05% | 4.03% |
| 4 | Indonesia | 3.36% | 2.69% | 3.57% |
| 5 | United Arab Emirates | 3.04% | 3.66% | 3.27% |
| 6 | Singapore↑ | 2.58% | 2.72% | 3.15% |
| 7 | Germany | 3.22% | 4.19% | 3.09% |
| 8 | China↓ | 3.88% | 3.18% | 3.01% |
| 9 | India | 3.26% | 3.58% | 2.95% |
| 10 | Russian Federation↑ | 2.51% | 2.64% | 2.78% |
| 11 | United Kingdom↑ | 2.33% | 2.48% | 2.57% |
| 12 | Italy | 2.51% | 3.06% | 2.50% |
| 13 | Saudi Arabia | 2.65% | 2.98% | 2.04% |
| 14 | Malaysia↑ | 1.02% | 1.61% | 1.96% |
| 15 | Thailand | 1.90% | 1.69% | 1.92% |
| 16 | Netherlands | 1.50% | 2.46% | 1.86% |
| 17 | Oman | 1.24% | 1.02% | 1.85% |
| 18 | France | 1.99% | 2.02% | 1.75% |
| 19 | Norway↑ | 0.96% | 1.54% | 1.74% |
| 20 | Venezuela↑ | 1.23% | 1.31% | 1.68% |
Note: "↑" represents that the indicators listed continued to increase from 2010 to 2012 "↓"represents that the indicators listed continued to decrease from 2010 to 2012.
Judging from the market share, from 2010 to 2012, the proportion of import value in USA, Republic of Korea, Singapore, Russian Federation, United Kingdom, Malaysia, Norway and Venezuela continued to rise, while only that of China continued to decline.
Global Tubes, Pipes and Hollow Profiles, Seamless, of Iron or Steel Major Import Countries, from Jan. to Jun. 2013
| No. | Import Countries/Regions | Import Value(Thousand USD) from Jan. to Jun. 2013 | Year-on-Year |
| 1 | USA | 2,480,368 | -27.12% |
| 2 | Republic of Korea | 865,085 | 8.06% |
| 3 | Russian Federation | 744,711 | 45.94% |
| 4 | Singapore | 638,828 | 6.06% |
| 5 | Indonesia | 610,657 | -10.27% |
| 6 | Canada | 595,803 | -25.50% |
| 7 | Germany | 576,477 | -13.78% |
| 8 | Italy | 499,483 | 0.85% |
| 9 | China | 493,364 | -19.92% |
| 10 | India | 412,432 | -26.65% |
| 11 | Netherlands | 408,639 | 23.36% |
| 12 | United Kingdom | 399,194 | -26.45% |
| 13 | Malaysia | 344,414 | 6.99% |
| 14 | Thailand | 338,117 | 5.04% |
| 15 | France | 336,006 | -5.65% |
| 16 | Norway | 334,812 | -0.99% |
| 17 | Kazakhstan | 280,232 | 68.32% |
| 18 | Australia | 258,176 | -19.67% |
| 19 | Mexico | 243,425 | -7.83% |
| 20 | Brazil | 228,653 | 2.66% |
From Jan. to Jun. 2013, global Tubes, Pipes and Hollow Profiles, Seamless, of Iron or Steel main import markets were USA, Republic of Korea, Russian Federation, Singapore, Indonesia, Canada, Germany, Italy, China and India . Among the top twenty global Tubes, Pipes and Hollow Profiles, Seamless, of Iron or Steel import markets, Kazakhstan had the largest increase of import value year on year( 68.32%)


