Note:
HS:854140
Photosensitive semiconduct device, photovoltaic battery s & light emit diodes (expect solar battery)
Global Solar Battery (HS:854140) Demand Analysis
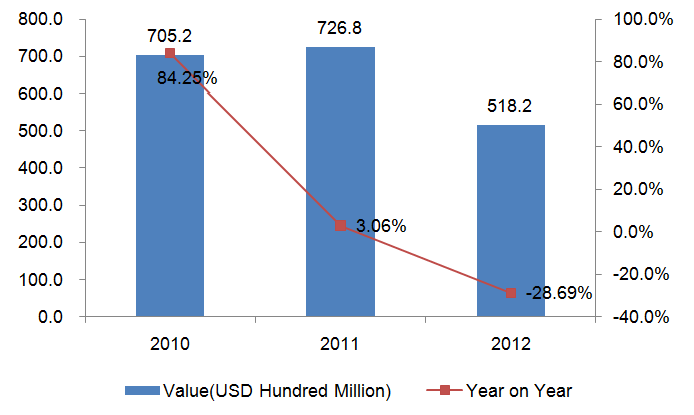
The Trend of Global Solar Battery Demand between 2010 and 2012(HS:854140)
Major Solar Battery Demand Country/Region in 2012
| No. | Import Country/Region | Import Value(a Thousand USD) | Compared with the same period of 2011 |
| 1 | China | 7,870,614 | -1.68% |
| 2 | USA | 7,259,857 | 0.93% |
| 3 | Germany | 5,931,428 | -52.08% |
| 4 | Netherlands | 5,217,595 | -28.53% |
| 5 | Japan | 3,094,011 | 34.15% |
| 6 | Korea | 3,029,125 | 7.36% |
| 7 | Italy | 2,907,941 | -69.38% |
| 8 | Belgium | 1,555,814 | -42.05% |
| 9 | Taiwan | 1,224,480 | -0.32% |
| 10 | Mexico | 1,207,769 | 9.12% |
| 11 | Greece | 1,031,091 | 30.65% |
| 12 | France | 1,012,978 | -68.29% |
| 13 | Australia | 1,010,087 | -33.59% |
| 14 | UK | 883,387 | -41.50% |
| 15 | India | 876,039 | -32.55% |
| 16 | Bulgaria | 735,410 | 78.94% |
| 17 | Singapore | 729,405 | -19.43% |
| 18 | Thailand | 683,065 | 4.38% |
| 19 | Canada | 510,205 | -48.66% |
| 20 | Spain | 469,554 | -62.85% |
The global solar battery import value reached $ 72.68 billion at 2011, increased 3.06% year to year ratio. But $ 51.82 billion at 2012 only, dropped 28.69% compared with last year.
2012 major solar battery demand country/Region includes: China, USA, Germany, Netherlands, Japan, Korea, Italy, Belgium, Taiwan, Mexico, Greece, France, Australia, UK, India, Bulgaria, Singapore, Thailand, Canada and Spain.
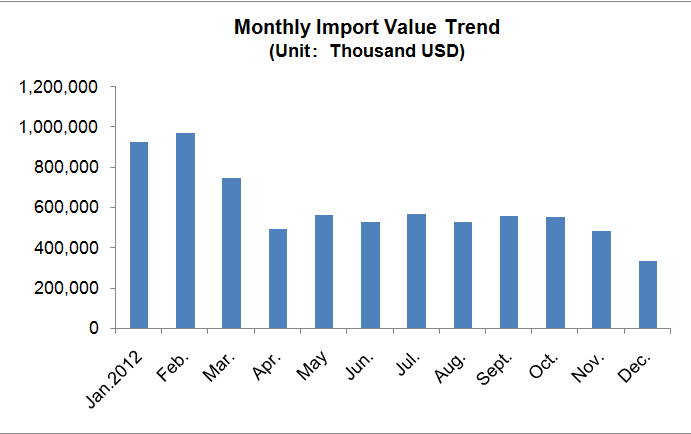
Monthly Trend of USA Solar Battery Import Value in 2012
Major country/region of USA solar battery import in 2012 (Ranked by import value)
| No. | Import Country/Region | Import Value(USD thousand) | Proportion |
| 1 | China | 2,311,244 | 31.84% |
| 2 | Malaysia | 1,785,740 | 24.60% |
| 3 | Japan | 679,045 | 9.35% |
| 4 | Mexico | 549,969 | 7.58% |
| 5 | Taiwan | 480,683 | 6.62% |
| 6 | Philippines | 442,257 | 6.09% |
| 7 | Korea | 350,062 | 4.82% |
| 8 | Germany | 241,718 | 3.33% |
| 9 | Singapore | 94,210 | 1.30% |
| 10 | Canada | 81,691 | 1.13% |
The major original places of solar battery delivered include: China, Malaysia, Japan, Mexico, Taiwan, Philippines, Korea, Germany, Singapore and Canada. As first one, the import value from China reached 2,311,244 a thousand U.S. Dollars in 2012, and the proportion was 31.84%. The next one is Malaysia, which took 24.60% marketing share.
Monthly trend of USA solar battery import value in 2012 shows that the first season took maximum for the annual amount of imports
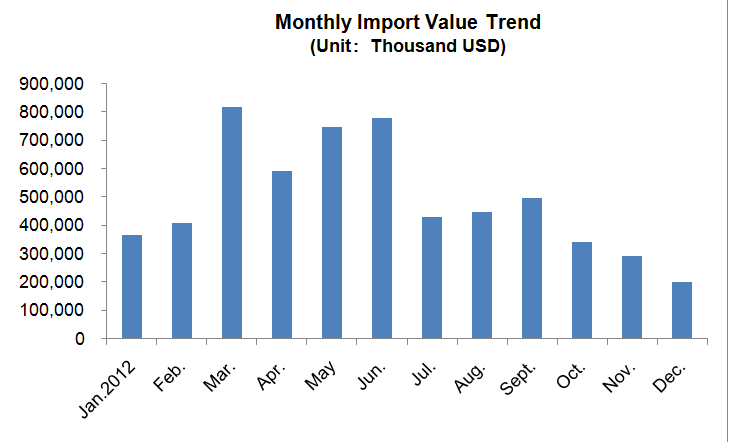
Monthly Trend of Germany Solar Battery Import Value in 2012
Major country/region of Germany solar battery import in 2012 (Ranked by import value)
| No. | Import Country/Region | Import Value(USD thousand) | Proportion |
| 1 | China | 2,405,151 | 37.17% |
| 2 | Netherlands | 1,734,205 | 26.80% |
| 3 | Malaysia | 361,549 | 5.59% |
| 4 | Taiwan | 341,223 | 5.27% |
| 5 | USA | 186,879 | 2.89% |
| 6 | Poland | 179,674 | 2.78% |
| 7 | Japan | 168,087 | 2.60% |
| 8 | Italy | 146,251 | 2.26% |
| 9 | Czech | 144,779 | 2.24% |
| 10 | Belgium | 131,110 | 2.03% |
The major original places of solar battery delivered include: China, Netherlands, Malaysia, Taiwan, USA, Poland, Japan, Italy, Czech and Belgium. As first one, the import value from China reached 2,405,151 a thousand U.S. Dollars in 2012, and the proportion was 37.17%. The next one is Netherlands, which took 26.8% marketing share.
Monthly trend of USA solar battery import value in 2012 shows that the second half year is lower the first half for the annual amount of imports.
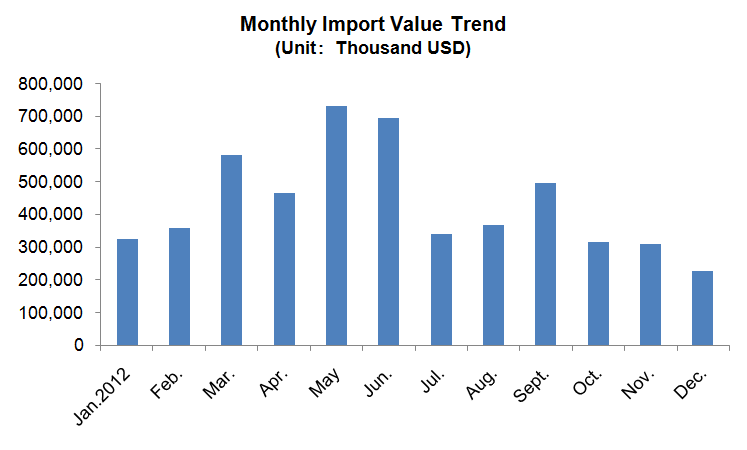
Monthly Trend of Netherlands Solar Battery Import Value in 2012
Major country/region of Netherlands solar battery import in 2012 (Ranked by import value)
| No. | Import Country/Region | Import Value(USD thousand) | Proportion |
| 1 | China | 4,019,069 | 76.72% |
| 2 | Singapore | 473,588 | 9.04% |
| 3 | Philippines | 137,249 | 2.62% |
| 4 | Germany | 135,849 | 2.59% |
| 5 | Taiwan | 133,396 | 2.55% |
| 6 | Malaysia | 125,361 | 2.39% |
| 7 | France | 31,486 | 0.60% |
| 8 | India | 31,430 | 0.60% |
| 9 | Korea | 29,567 | 0.56% |
| 10 | Japan | 29,522 | 0.56% |
The major original places of solar battery delivered include: China, Singapore, Philippines, Germany, Taiwan, Malaysia, France, India, Korea and Japan. As first one, the import value from China reached 4,019,069 a thousand U.S. Dollars in 2012, and the proportion was 76.72%, which took huge competitive advantage.
Monthly trend of Netherlands solar battery import value in 2012 shows that the second half year is lower the first half for the annual amount of imports.
Belgium Solar Battery Demand Analysis(HS:854140)
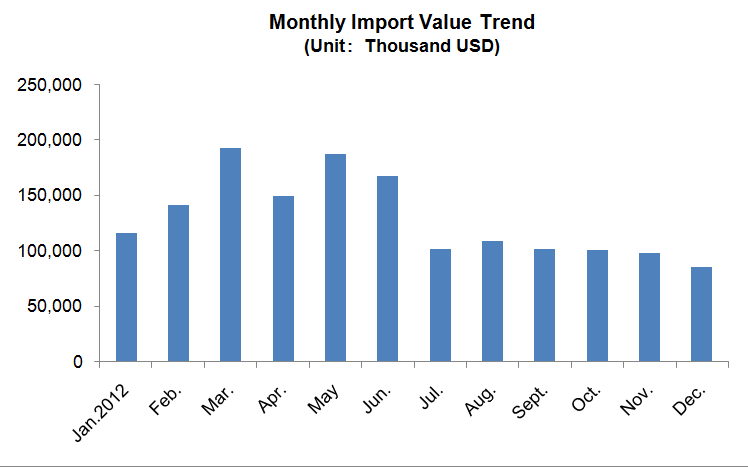
Monthly Trend of Belgium Solar Battery Import Value in 2012
Major country/region of Belgium solar battery import in 2012 (Ranked by import value)
| No. | Import Country/Region | Import Value(USD thousand) | Proportion |
| 1 | China | 962,894 | 60.79% |
| 2 | Netherlands | 226,569 | 14.31% |
| 3 | Germany | 187,621 | 11.85% |
| 4 | Luxembourg | 53,456 | 3.38% |
| 5 | France | 32,300 | 2.04% |
| 6 | Korea | 23,503 | 1.48% |
| 7 | Spain | 16,567 | 1.05% |
| 8 | Austria | 11,546 | 0.73% |
| 9 | Japan | 10,901 | 0.69% |
| 10 | HK | 8,440 | 0.53% |
The major original places of solar battery delivered include: China, Netherlands, Germany, Luxembourg, France, Korea, Spain, Austria, Japan and HK. As first one, the import value from China reached 962,894 a thousand U.S. Dollars in 2012, and the proportion was 60.79%.
Monthly trend of Belgium solar battery import value in 2012 shows that the second half year is lower the first half for the annual amount of imports.
Data Source:UN COMTRADE


