2009-2011 Chinese Vitamin C and Its Derivatives (HS: 29362700) Export Data Analysis
2009-2011 Major Chinese Vitamin C and Its Derivatives Importers (Sorted by Export Value in 2011)
| No. | Countries/Regions | 2009 | 2010 | 2011 | |||
| Export Value (USD) | Proportion (%) | Export Value (USD) | Proportion (%) | Export Value (USD) | Proportion (%) | ||
|
| Total | 789,405,926 | 100% | 798,390,435 | 100% | 561,823,595 | 100% |
| 1 | USA | 194,685,057 | 24.7% | 197,698,421 | 24.8% | 122,249,525 | 21.8% |
| 2 | Germany↑ | 129,451,951 | 16.4% | 144,028,805 | 18.0% | 102,236,409 | 18.2% |
| 3 | Japan | 103,233,266 | 13.1% | 95,155,331 | 11.9% | 85,994,903 | 15.3% |
| 4 | Belgium | 33,273,505 | 4.2% | 28,690,943 | 3.6% | 24,951,818 | 4.4% |
| 5 | Holland↓ | 42,215,774 | 5.3% | 32,535,764 | 4.1% | 16,992,141 | 3.0% |
| 6 | UK | 22,797,930 | 2.9% | 16,934,070 | 2.1% | 16,668,429 | 3.0% |
| 7 | Brazil | 21,709,092 | 2.8% | 21,102,144 | 2.6% | 14,371,527 | 2.6% |
| 8 | Indonesia | 13,280,793 | 1.7% | 14,763,882 | 1.8% | 12,003,267 | 2.1% |
| 9 | Italy | 15,215,315 | 1.9% | 19,036,492 | 2.4% | 11,938,473 | 2.1% |
| 10 | South Korea↓ | 16,805,749 | 2.1% | 15,471,528 | 1.9% | 10,129,586 | 1.8% |
Note: “↑” indicates that the countries which proportion covered by import value in the total Chinese export values grew continuously from 2009 to 2011; “↓” indicates that the countries which proportion covered by import value in the total Chinese export values declined continuously from 2009 to 2011.
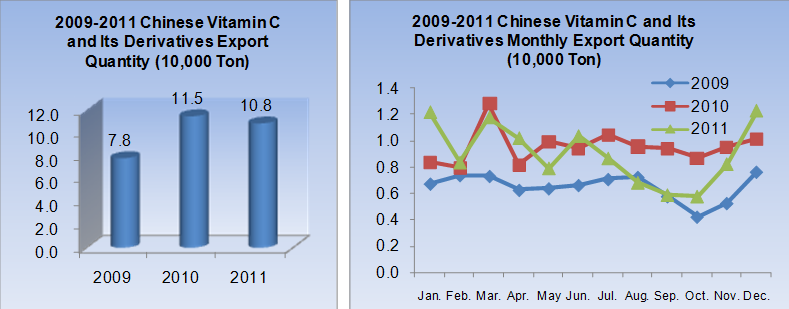
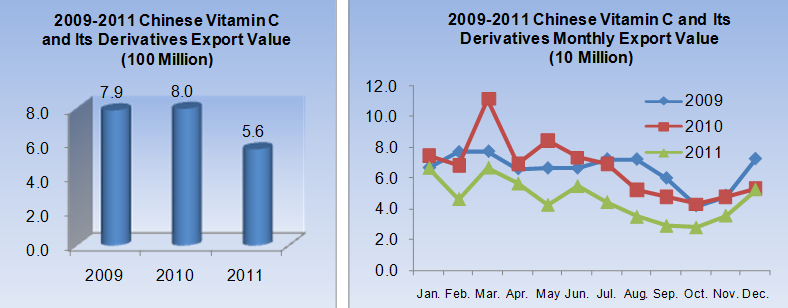
Total export values and quantities: both the total export values and quantities of Chinese vitamin C and its derivatives presented the shape of Inverted “V” from 2009 to 2011. Because of the influence of economic crisis in 2009, the export quantity decreased 8.4%. As for the recovery of the economic conditions in 2010, the export quantity grew sharply, up 46.9% compared to 2009; however, on account of the drop of the average export unit price, the export value only increased 1.1% year on year. In 2011, both the export quantity and value held a trend of decline.
Average export unit price: in the past 3 years, the average export unit price of Chinese vitamin C and its derivatives was with a large drop continuously, down 31.1% in comparison with 2009 and down 25.6% compared to 2011.
Export seasonal variations: according to export quantity and value monthly trends, the export peak of the whole year were from March to July. Compared to the first half of the year, the second half of the year export declined obviously, and the lowest point was in October, but November and December recovered slightly.
Export markets: the top three export markets of Chinese vitamin C and its derivatives were still USA, Germany and Japan from 2009 to 2011. According to the changes of the market shares, in the past 3 years, German and Indonesia’s export value for China kept growing continuously. The proportion of Germany and Indonesia were added up to 1.8% and 0.5% respectively in 2011 compared to 2009. In addition, Japanese market share also increased significantly in 2011, up 2.2% compared to 2009. However, Holland and German export value proportion decreased continuously, with a drop of 2.3% and 0.3% respectively in 2011 compared to 2009. What’s more, the export value for USA, the largest export market, fell down 38.2% year on year, with a drop of 3% in comparison with 2009.
All in all, as for the recovery of global economy in 2010, the export quantity of Chinese vitamin C and its derivatives grew sharply. Because the average export unit price decreased significantly in 2011 and the export quantity was with a small drop, the export value declined 30% year on year. The first half of the year was the export peak of Chinese vitamin C and its derivatives, so the related export companies should seize the export opportunity and prepare good enough in advance. In 2012, the export condition of Chinese vitamin C and its derivatives was serious, and the drop of price was still obvious. In the field of export market, the export data for Germany, Indonesia and Japan was good relatively; the export conditions for USA, Holland and South Korea were serious relatively. However, as the largest export market, America’s place was still stable.


