2009- Jun. 2012 Chinese Trolley Export Quantity
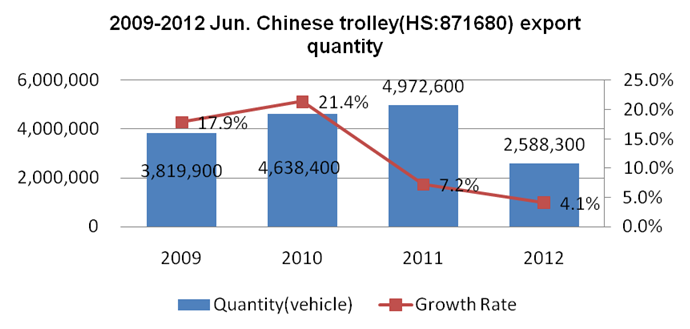
Since 2009, the export quantity of Chinese trolley increased year by year, however, from the chart, we can see that the growth rate of export quantity slowed down. In the first half of 2012, the export of Chinese trolley amounted 25.883 million, up 4.1% over the previous year.
2009- Jun. 2012 Chinese Trolley Export Value
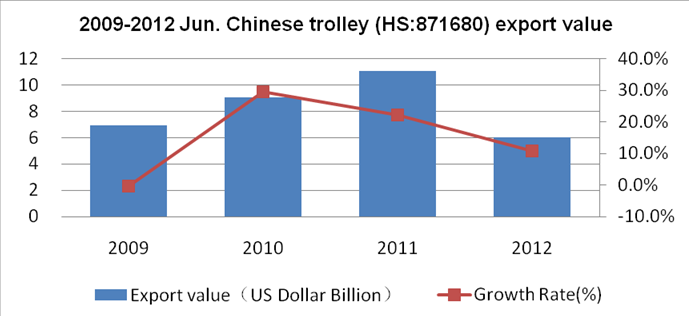
The export value and export quantity of Chinese trolley keep a consistent trend, but from 2010 to the first half of 2012, the growth rate of export value is higher than the export quantity. In the first half of 2012, the export value reached 600 million dollars, a rise of 10.9% year on year.
2009- Jun. 2012 Chinese Trolley Export Monthly Quantity
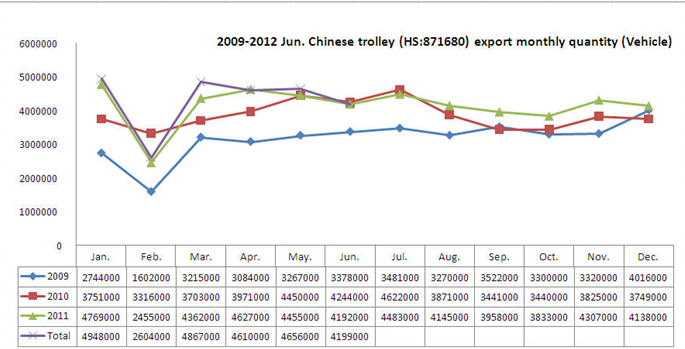
From the chart of Chinese trolleys'export monthly quantity from 2009 to Jun. 2012, we can see a trough in February, also, there are some fluctuations in other months. Look at the monthly trend from 2010-2011; the export quantity in the first half of the year is higher than the second half.
2009- Jun. 2012 Chinese Trolley Monthly Average Export Unit Price
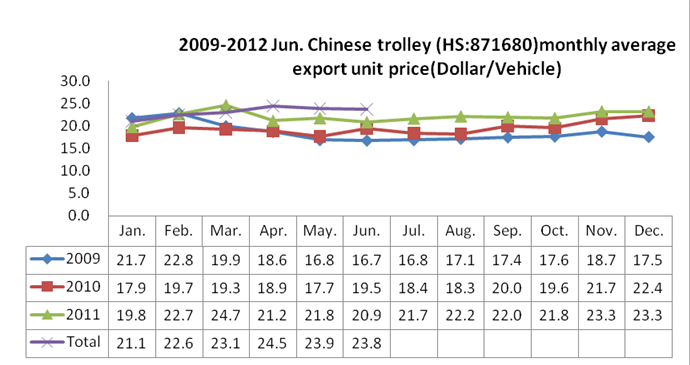
Chinese trolley average export unit price increased year by year, The growth rate in 2010 and 2011 each reached 6.6% and 13.9%, in the first half of 2012, the growth rate was 11.7%, compared to the same period.
Import Value of Main Chinese Trolley Importers, 2009-2011
| No. | Import Countries/Regions | Import Value(US Dollar Thousand) | Amount in 2011compared with 2009 | ||
| 2009 | 2010 | 2011 | |||
| 1 | USA | 21,462.00 | 27,845.00 | 30,512.30 | 42.20% |
| 2 | Japan | 6,518.40 | 8,441.40 | 10,728.50 | 64.60% |
| 3 | Britain | 4,290.50 | 6,932.70 | 9,196.20 | 114.30% |
| 4 | Australia | 4,722.80 | 4,957.50 | 6,195.60 | 31.20% |
| 5 | Netherlands | 2,835.50 | 4,454.70 | 5,332.40 | 88.10% |
| 6 | Germany | 3,809.50 | 4,666.50 | 4,631.90 | 21.60% |
| 7 | Canada | 2,389.20 | 2,479.30 | 3,733.20 | 56.30% |
| 8 | The Russian Federation | 1,018.10 | 2,077.60 | 3,442.50 | 238.10% |
| 9 | France | 2,158.60 | 2,032.40 | 2,530.30 | 17.20% |
| 10 | Sweden | 1,220.90 | 1,402.80 | 1,867.40 | 53.00% |
| 11 | Malaysia | 1,204.60 | 1,387.80 | 1,688.20 | 40.10% |
| 12 | Belgium | 1,172.40 | 1,130.10 | 1,544.60 | 31.70% |
| 13 | Spain | 862.9 | 1,429.10 | 1,410.20 | 63.40% |
| 14 | United Arab Emirates | 1,024.40 | 1,243.20 | 1,249.50 | 22.00% |
| 15 | South Africa | 525.7 | 844.6 | 1,145.90 | 118.00% |
| 16 | Saudi Arabia | 580.1 | 875 | 1,123.60 | 93.70% |
| 17 | Italy | 1,049.70 | 1,115.30 | 1,116.40 | 6.40% |
| 18 | The Republic of Korea | 404.7 | 859.6 | 901.3 | 122.70% |
| 19 | Thailand | 202.9 | 545.2 | 835.5 | 311.70% |
| 20 | Chile | 529.9 | 726.2 | 828.5 | 56.30% |
USA, Japan, the United Kingdom, Australia and the Netherlands are the top five export markets in China, accounted for 27.8%、9.8%、8.4%、5.6%、4.9% of the total export value respectively. From the export growth situation, the largest growth rate of export was in Thailand among the 20 export markets (up 311.7% over the previous year in 2011), followed by the Russian Federation (2011 compared with 2009, an increase of 238.1%), in addition, the growth rate which increased more than 1 times countries include the United Kingdom, South Africa and South Korea. Compared with 2009, the three importers with the highest growth rate of Chinese trolley were USA (an increase of $ 90.503 million), United Kingdom (an increase of $ 49.057 million) and Japan ($ 42.1 million increase).
The Market Share of Main Chinese Trolley Importers, 2009-2011
| No. | Import Countries/Regions | Import value Share | ||
| 2009 | 2010 | 2011 | ||
| 1 | USA | 30.90% | 31.00% | 27.80% |
| 2 | Japan | 9.40% | 9.40% | 9.80% |
| 3 | Britain↑ | 6.20% | 7.70% | 8.40% |
| 4 | Australia | 6.80% | 5.50% | 5.60% |
| 5 | Netherlands | 4.10% | 5.00% | 4.90% |
| 6 | Germany↓ | 5.50% | 5.20% | 4.20% |
| 7 | Canada | 3.40% | 2.80% | 3.40% |
| 8 | The Russian Federation↑ | 1.50% | 2.30% | 3.10% |
| 9 | France | 3.10% | 2.30% | 2.30% |
| 10 | Sweden | 1.80% | 1.60% | 1.70% |
| 11 | Malaysia | 1.70% | 1.50% | 1.50% |
| 12 | Belgium | 1.70% | 1.30% | 1.40% |
| 13 | Spain | 1.20% | 1.60% | 1.30% |
| 14 | United Arab Emirates↓ | 1.50% | 1.40% | 1.10% |
| 15 | South Africa↑ | 0.80% | 0.90% | 1.00% |
| 16 | Saudi Arabia | 0.80% | 1.00% | 1.00% |
| 17 | Italy↓ | 1.50% | 1.20% | 1.00% |
| 18 | The Republic of Korea | 0.60% | 1.00% | 0.80% |
| 19 | Thailand↑ | 0.30% | 0.60% | 0.80% |
| 20 | Chile | 0.80% | 0.80% | 0.80% |
Note: "↑"indicates that the index grow continuously from 2009 to 2011," ↓"indicates that the index decline continuously from 2009 to 2011
Among the 20 countries, the export market share of the total export market share keeping rising countries are the United Kingdom (compared with 2009, up 2.2 percentage in 2011), Russian Federation (an increase of 1.6 percent year on year), South Africa (a rise of 0.2 percent over the previous year), Thailand (an increase of 0.5 percentage compared with 2009 in 2011)
The countries keeping dropping were Germany (compared with 2009 decreased by 1.3 percentage points in 2011), the United Arab Emirates (in 2011 fell by 0.4 percentage points compared with 2009), Italy (in 2011 decreased by 0.5 percentage points compared with 2009), In addition, USA, Australia and France dropped significantly, each dropped 3.1, 1.2 and 0.5 percentage points compared with 2011.


