Annual Export Trends of China's Gas Turbines from 2012 to 2015
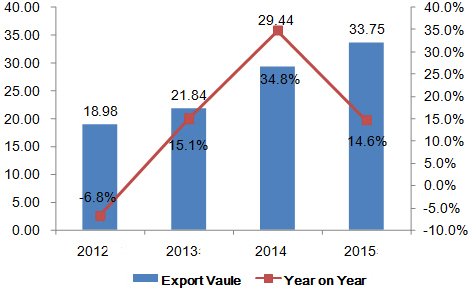
China's gas turbines export has trended up during the period from 2012 to 2015. The export value in 2015 was USD 3,375,000,000, growing 77.8% on 2012.
Monthly Export Trends of China's Gas Turbines from 2012 to 2015
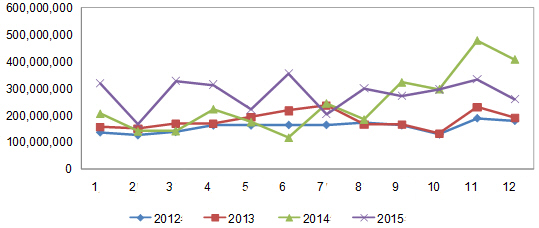
In 2015, China's gas turbines exports peak was in June and trough was in February
China's Gas Turbines Export Volume & Value in 2015
| Month | Volume | Value(USD) | on Year | |
| Volume | Value | |||
| January | 3,322,675 | 319,116,978 | -23.20% | 59.30% |
| February | 3,211,697 | 168,882,456 | 67% | 19.50% |
| March | 3,442,591 | 328,619,341 | 31.30% | 130.60% |
| April | 3,476,695 | 313,534,979 | 12.60% | 40.20% |
| May | 2,481,861 | 222,358,500 | -19.30% | 26.40% |
| June | 2,735,072 | 354,720,936 | 12.30% | 200.70% |
| July | 2,318,833 | 204,287,317 | -34.10% | -16.50% |
| August | 4,413,654 | 300,010,838 | 33.80% | 61.90% |
| September | 2,811,595 | 273,075,060 | -15.40% | -15.40% |
| October | 2,800,987 | 295,884,036 | -34.30% | -0.70% |
| November | 3,044,012 | 334,493,524 | -5.70% | -30% |
| December | 3,988,212 | 260,130,909 | -24.70% | -36.20% |
| Total | 38,047,884 | 3,375,114,874 | -5.80% | 14.90% |
From January to December in 2015, China's gas turbines export value reached USD 3,375,000,000, growing 14.9% on year.
Export Destinations for China's Gas Turbines in 2015
| No. | Country/Region | Volume | Value(USD) | on Year | |
| Volume | Value | ||||
| 1 | Hong Kong | 160,985 | 1,315,607,744 | 43% | 30.10% |
| 2 | United States | 12,067,489 | 870,095,164 | -1.80% | 8.20% |
| 3 | Singapore | 126,440 | 206,547,668 | 81.80% | 110.60% |
| 4 | France | 948,955 | 180,043,032 | 49.70% | 1.30% |
| 5 | Germany | 598,533 | 91,614,263 | -46% | -40.70% |
| 6 | United Kingdom | 200,091 | 76,838,581 | -71.50% | -21.80% |
| 7 | Canada | 502,064 | 71,132,597 | 54.90% | 1.50% |
| 8 | Japan | 1,493,717 | 67,214,358 | -31.50% | 120.90% |
| 9 | India | 100,426 | 61,551,803 | -91.30% | -10.50% |
| 10 | Hungary | 410,525 | 57,254,534 | 61% | 133.70% |
From January to December in 2015, the top export destinations of China's gas turbines parts were the United States, Hong Kong and Singapore. In 2015, China exports to UAE grew faster than exports to other markets and the growth was 4688.3% on year.
Export Origins of China's Gas Turbines in 2015
| No. | District | Volume | Value(USD) | on Year | |
| Volume | Value | ||||
| 1 | Guangdong | 5,265,056 | 1,269,304,302 | 24.70% | 104.10% |
| 2 | Fujian | 118,934 | 510,590,533 | -8.10% | -11% |
| 3 | Jiangsu | 2,878,002 | 460,072,865 | -51.80% | -7.30% |
| 4 | Sichuan | 1,991,591 | 301,328,863 | -0.10% | 6.10% |
| 5 | Shaanxi | 376,476 | 190,966,843 | 6.40% | 5.40% |
| 6 | Liaoning | 1,729,918 | 147,914,744 | -19.60% | 27.30% |
| 7 | Beijing | 636,242 | 82,894,577 | -0.60% | -47% |
| 8 | Shanghai | 5,412,338 | 74,136,377 | 34.30% | -56.40% |
| 9 | Shandong | 3,381,349 | 73,976,402 | 17.30% | 20% |
| 10 | Zhejiang | 6,303,408 | 72,200,814 | 14.40% | 4.20% |
The top export origins of China's gas turbines were Guangdong province and Fujian province in 2015. Guangdong province exported USD 1,269,304,302, making the largest export origin in China. The average export price for gas turbines from Hainan was the highest.


