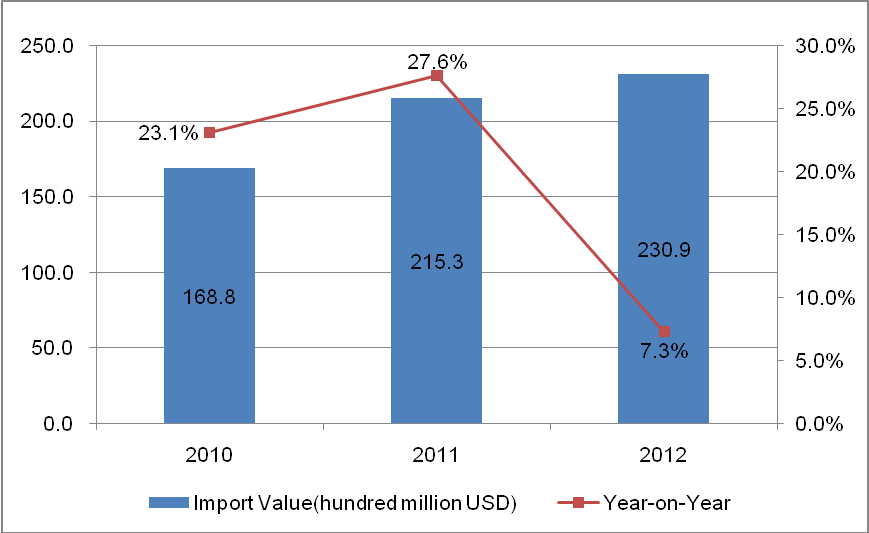
Global Import Value Trend of Collections (HS: 97) from 2010 to 2012

The total import value of global collections increased year by year from 2010 to 2012, and the import value of 2012 amounted to 23.09 billion US dollars, with an increase of 7.3% year on year.
Collections (HS: 97) Main Importing Countries in the First Quarter of 2013
| Main Import Countries/Regions | Import Value of the First Quarter of 2013 (thousand US dollars) | Year on Year |
| USA | 1,662,525 | -9.2% |
| Switzerland | 533,672 | 43.0% |
| France | 152,651 | -16.5% |
| China | 29,816 | 201.7% |
| Japan | 80,670 | 126.0% |
| South Korea | 33,768 | 26.7% |
| Australia | 36,706 | 7.9% |
| Thailand | 1,868 | 190.1% |
| Brazil | 11,778 | 75.4% |
| Czech | 4,686 | -16.6% |
Global collections main importing countries/regions are the United States, Switzerland, France, Japan, South Korea, Australia, Brazil, New Zealand, Portugal and Ireland.
Collections (HS: 97) Main Export Countries/Regions in the First Quarter of 2013
| Main Export Countries/Regions | Export Value of the First Quarter of 2013 (thousand US dollars) | Year on Year |
| USA | 1,691,209 | -15.3% |
| UK | 1,184,545 | 20.5% |
| Switzerland | 509,770 | 36.4% |
| France | 378,239 | 1.2% |
| Italy | 212,116 | 299.1% |
| China | 198,255 | 137.0% |
| Germany | 123,504 | -29.7% |
| Canada | 65,308 | 28.7% |
| Japan | 46,653 | 90.9% |
| Austria | 36,002 | 37.5% |
According to statistics of the first quarter of 2013, the United States was the first exporter of collections. The United States' export value of collections in the first quarter of 2013 amounted to 1.69 billion US dollars, with a decrease of 15.3%, followed by the United Kingdom, with the export value of 1.18 billion US dollars, with an increase of 20.5%. China ranked the sixth, and the export value of which was 198 million US dollars, with an increase of 137%.
Source: UN COMTRADE


