China Holiday Supplies (HS: 9505) Exports in 2013
China Holiday Supplies Export Volume and Value from Jan. to June in 2013
| Month | Volume (kg) | Value (USD) | YOY | |
|
|
|
| Volume | Value |
| January | 9,446,908 | 59,595,432 | 26.5% | 63.4% |
| February | 6,310,152 | 36,977,897 | 121.7% | 195.5% |
| March | 7,561,822 | 62,278,174 | 17.1% | 105.5% |
| April | 12,629,717 | 96,047,906 | -8.7% | 8% |
| May | 20,604,940 | 151,888,859 | -13.3% | -30.5% |
| June | 34,628,226 | 292,924,413 | -7.5% | 1.3% |
| Jan. to June Total | 91,181,765 | 699,712,681 | -0.7% | 3.5% |
The export volume of China holiday supplies from Jan. to June in 2013 amounted to 91,200 tons, with a decrease of 0.7%, while the export value amounted to 700 million US dollars, with an increase of 3.5%.
China Holiday Supplies Major Export Countries/Regions Distribution from Jan. to June in 2013
| No. | Countries/Regions | Volume (kg) | Value (USD) | YOY | |
|
|
|
|
| Volume | Value |
| 1 | USA | 33,823,583 | 246,189,805 | -10.2% | -12.7% |
| 2 | Netherlands | 4,645,958 | 41,196,663 | -2.2% | -8.5% |
| 3 | Brazil | 5,099,103 | 39,984,428 | -0.3% | 28.1% |
| 4 | Germany | 3,343,971 | 34,359,518 | -11.7% | 0.7% |
| 5 | UK | 3,305,538 | 32,113,603 | 8.6% | 37.3% |
| 6 | Panama | 1,819,628 | 21,027,523 | -31.7% | -33.3% |
| 7 | Singapore | 1,822,556 | 20,598,871 | 108.3% | 79.6% |
| 8 | Canada | 1,784,906 | 16,879,679 | -15.7% | -0.2% |
| 9 | Italy | 2,195,146 | 16,733,850 | -26.1% | -21% |
| 10 | France | 1,803,320 | 15,726,771 | 129.5% | 159.1% |
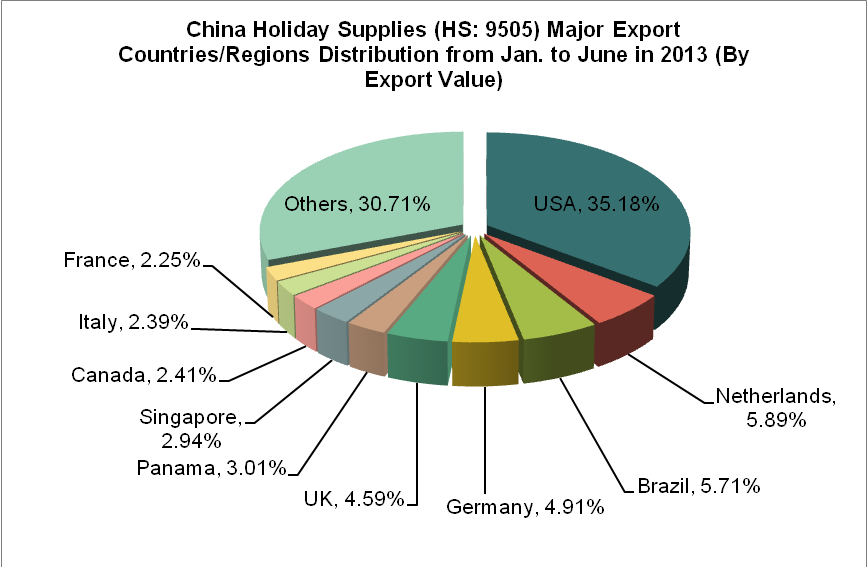
From Jan. to June in 2013, among the first ten export destination countries/regions, the export value of China holiday supplies to five countries/regions of them increased. Seen from the export value in proportion, there is the greatest increase in France (with an increase of 159.1% year on year), followed by Singapore (with an increase of 79.6% year on year).
China Holiday Supplies Original Places of Exported Goods from Jan. to June in 2013
| No. | Regions | Volume (kg) | Value (USD) | YOY | |
|
|
|
|
| Volume | Value |
| 1 | Guangdong | 41,780,813 | 298,205,761 | -12.9% | -7.3% |
| 2 | Zhejiang | 22,759,965 | 116,246,385 | -4.3% | -0.2% |
| 3 | Anhui | 4,312,643 | 53,676,013 | 156.2% | 362.8% |
| 4 | Henan | 3,321,115 | 45,416,614 | 323.7% | 676.4% |
| 5 | Jiangsu | 2,634,816 | 27,781,115 | 13.3% | 18.9% |
| 6 | Fujian | 4,525,932 | 27,701,240 | 3.6% | 8.8% |
| 7 | Liaoning | 2,340,958 | 26,142,351 | -6.6% | -6.6% |
| 8 | Shandong | 2,565,686 | 23,533,532 | 156% | 184.9% |
| 9 | Chongqing | 643,997 | 18,549,671 | -61.7% | -72.3% |
| 10 | Jiangxi | 1,346,772 | 17,109,647 | 21% | -5.5% |
Guangdong and Zhejiang are China holiday supplies major original places of exported goods. From Jan. to June in 2013, the export volume of the above two provinces accounted for 70.78% of China's total export volume of the product, while the export value accounted for 59.23% of the total export value. Among the top ten original places of holiday supplies of our country, the export volume and value in Henan increased the largest, with an increase of 323.7% of the export volume and 676.4% of the export value.
(Source: China Customs Network)


