2010-2012 Chinese Plastic Machinery Export Trend Analysis
2010-2012 Chinese Plastic Machinery Export Quantity Trend Analysis
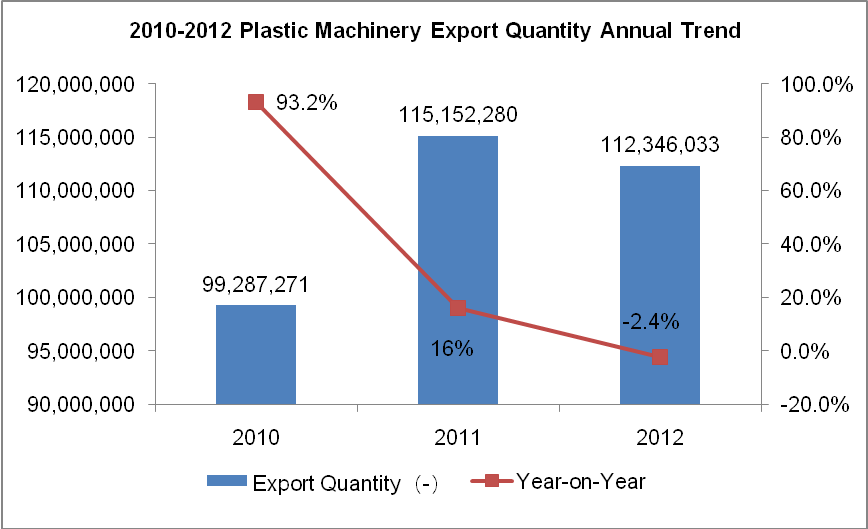
2010-2012 Plastic Machinery Export Quantity Annual Trend

From 2010 to 2012 Chinese plastic machinery Export quantity are 99287000, 115000000 and 112000000,with an increase of 93.2%, 16% and -2.4% compare the same time last year.
2010-2012 Chinese Plastic Machinery Export Value Trend Analysis
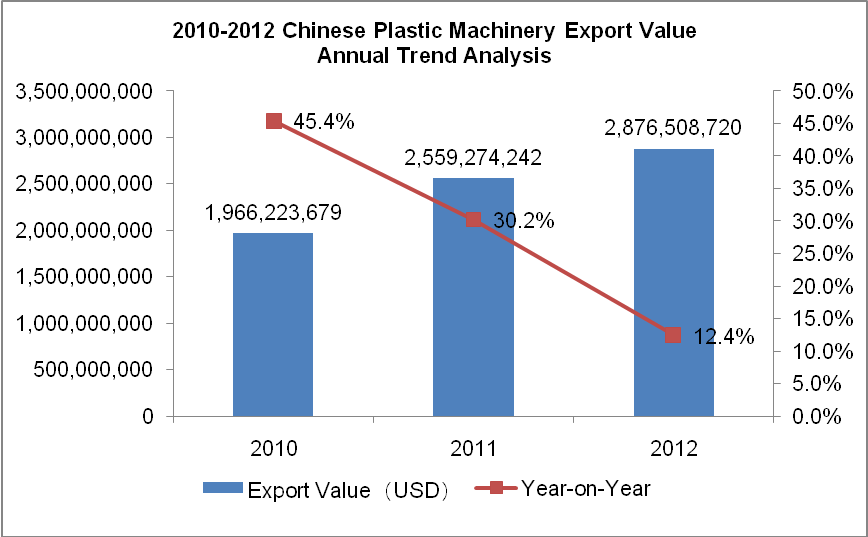
2010-2012 Chinese Plastic Machinery Export Value Annual Trend Analysis

From 2010 to 2012, Chinese plastic machinery Export Valuekeep rising, but the increasing speed slows down. Chinese plastic machinery Export Value are USD 1966000000, USD 2559000000 and USD 2877000000, with an increase of 45.4%, 30.2% and 12.4% compare the same time last year.
2010-2012 Chinese Plastic Machinery Export Country Trend Analysis
2010-2012 Chinese Plastic Machinery Export Country Trend
| No. | Country/Region | Export Value(USD) | Compared the Same Period Last Year | ||
|
|
| 2010 | 2011 | 2012 |
|
| 1 | Thailand | 110, 004, 503 | 180, 697, 370 | 228, 650, 134 | 107.86% |
| 2 | Indonesia | 118, 676, 542 | 171, 617, 420 | 204, 969, 664 | 72.71% |
| 3 | India | 158, 743, 188 | 188, 339, 346 | 187, 375, 158 | 18.04% |
| 4 | Brazil | 123, 591, 292 | 172, 723, 465 | 152, 646, 242 | 23.51% |
| 5 | Japan | 112, 952, 331 | 113, 292, 167 | 147, 281, 303 | 30.39% |
| 6 | United States | 45, 084, 824 | 81, 822, 642 | 135, 481, 037 | 200.50% |
| 7 | Vietnam | 92, 151, 136 | 109, 463, 467 | 126, 341, 589 | 37.10% |
| 8 | Turkey | 82, 798, 195 | 121, 210, 403 | 119, 853, 007 | 44.75% |
| 9 | Russian federation | 65, 971, 759 | 95, 255, 278 | 114, 006, 425 | 72.81% |
| 10 | Korea | 50, 979, 694 | 72, 334, 361 | 80, 453, 077 | 57.81% |
| 11 | Malaysia | 67, 416, 684 | 78, 578, 917 | 79, 588, 730 | 18.05% |
| 12 | Iran | 90, 669, 326 | 111, 552, 268 | 66, 005, 096 | -27.20% |
| 13 | Taiwan | 63, 222, 347 | 83, 163, 553 | 65, 746, 008 | 3.99% |
| 14 | Germany | 50, 011, 876 | 74, 298, 209 | 63, 817, 770 | 27.61% |
| 15 | Mexico | 23, 282, 971 | 41, 911, 525 | 60, 929, 251 | 161.69% |
| 16 | Myanmar | 10, 987, 605 | 10, 291, 056 | 48, 017, 013 | 337.01% |
| 17 | Egypt | 32, 523, 562 | 38, 625, 773 | 47, 726, 479 | 46.74% |
| 18 | Hongkong | 31, 826, 346 | 36, 762, 087 | 44, 995, 498 | 41.38% |
| 19 | Saudi Abrabia | 21, 570, 306 | 28, 534, 375 | 42, 019, 983 | 94.80% |
| 20 | Canada | 33, 031, 778 | 40, 090, 700 | 40, 945, 304 | 23.96% |
From 2010 to 2012, the main Export markets of Chinese plastic machinery are Thailand, Indonesia and India. In the year 2012, Chinese plastic machinery Export Value increased 107.86 %( Thailand), 200.50 %( United States), 161.69 %( Mexico) and 337.01 %( Myanmar) comparing the same time in the year 2010.
2010-2012 Chinese Plastic Machinery Export Country Changing Trend
| No | Country/Region | Export Value proportion | ||
|
|
| 2010 | 2011 | 2012 |
| 1 | Thailand↑ | 5.59% | 7.06% | 7.95% |
| 2 | Indonesia↑ | 6.04% | 6.71% | 7.13% |
| 3 | India↓ | 8.07% | 7.36% | 6.51% |
| 4 | Brazil | 6.29% | 6.75% | 5.31% |
| 5 | Japan | 5.74% | 4.43% | 5.12% |
| 6 | United States↑ | 2.29% | 3.20% | 4.71% |
| 7 | Vietnam | 4.69% | 4.28% | 4.39% |
| 8 | Turkey | 4.21% | 4.74% | 4.17% |
| 9 | Russian federation↑ | 3.36% | 3.72% | 3.96% |
| 10 | Korea | 2.59% | 2.83% | 2.80% |
| 11 | Malaysia ↓ | 3.43% | 3.07% | 2.77% |
| 12 | Iran↓ | 4.61% | 4.36% | 2.29% |
| 13 | Taiwan | 3.22% | 3.25% | 2.29% |
| 14 | Germany | 2.54% | 2.90% | 2.22% |
| 15 | Mexico↑ | 1.18% | 1.64% | 2.12% |
| 16 | Myanmar | 0.56% | 0.40% | 1.67% |
| 17 | Egypt | 1.65% | 1.51% | 1.66% |
| 18 | Hongkong | 1.62% | 1.44% | 1.56% |
| 19 | Saudi Abrabia↑ | 1.10% | 1.11% | 1.46% |
| 20 | Canada↓ | 1.68% | 1.57% | 1.42% |
In 2012, Thailand is the largest Export market of Chinese plastic machinery with the occupied amount proportion of 7.95%. Thailand became the first largest maket, at the same time, India became the third one.
From 2010 to 2012,the Export Values to Thailand, Indonesia, United States, Russian federation,Saudi Abrabia were increasd. The Export Values to India, Malaysia, Iran, and Canada were decreased.
Customs Information Network


