China Manganese Ores and Concentrates Export Volume and Value, from Jan. to Dec. 2013
| Month | Volume (Kg) | Value (USD) | Year-on-Year | |
| Volume | Value | |||
| Jan. | 15,581,903 | 3,116,312 | 0 | 0.3% |
| Feb. | 712,000 | 24,934 | -96.4% | -99.4% |
| Mar. | 17,180,340 | 3,315,208 | 218.2% | 165.3% |
| Apr. | 9,288,568 | 1,680,508 | 39.2% | 8.5% |
| May. | 6,662,687 | 1,106,628 | -69.7% | -70.8% |
| Jun. | 566,950 | 90,268 | -94.5% | -96.5% |
| Jul. | 20,000 | 3,250 | -99.9% | -99.9% |
| Aug. | 124,776 | 44,180 | -83.2% | -71.4% |
| Sept. | 98,030 | 43,698 | -98.6% | -96.1% |
| Oct. | 95,000 | 31,380 | -98.3% | -96.5% |
| Nov. | 184,000 | 34,000 | -66.7% | -72.8% |
| Dec. | 54,948 | 12,730 | -99.6% | -99.5% |
| Total | 50,569,202 | 9,503,096 | -59.6 | -60.3 |
The export volume of Chinese manganese ores and concentrates was 50.6 thousand tons, from Jan. to Dec. 2013, declined 59.6% year on year; the export value was 9.5031 million dollars, declined 60.3% year on year.
China Manganese Ores and Concentrates Major Export Countries/Regions Distribution, from Jan. to Dec. 2013
| No. | Countries/ Regions | Volume (Kg) | Value (USD) | Year-on-Year | ||
| Volume | Value | |||||
| 1 | India | 45,064,498 | 8,833,825 | -44.5% | -38% | |
| 2 | Italy | 1,053,000 | 204,455 | -55.7% | -55.9% | |
| 3 | Viet Nam | 3,257,000 | 114,345 | -91.5% | -98.6% | |
| 4 | Japan | 158,226 | 73,711 | -1.1% | -9.9% | |
| 5 | North Korea | 185,500 | 71,890 | -49.2% | -7.7% | |
| 6 | Thailand | 301,000 | 56,400 | -71.8% | -72.8% | |
| 7 | Republic of Korea | 240,000 | 40,075 | -7.7% | 18.9% | |
| 8 | Madagascar | 120,000 | 36,000 | 0 | 0 | |
| 9 | Morocco | 26,000 | 16,940 | 0 | 0 | |
| 10 | Bangladesh | 37,948 | 11,134 | 406% | 378.9% | |
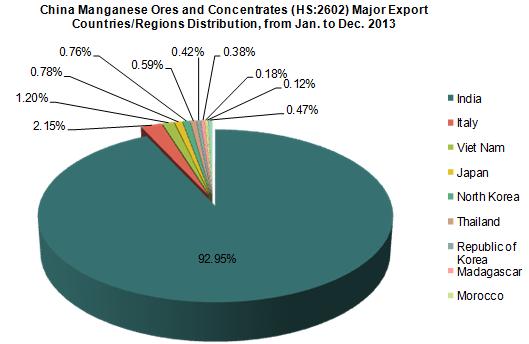
The largest export market for Chinese manganese ores and concentrates is India. The total export value to India was 8.8338 million dollars, from Jan. to Dec. 2013, with a decrease of 38% year on year. Among the total export value of manganese ores and concentrates, it accounted for 92.95%, followed by Italy, which accounted for 2.15%.
Among the top ten export countries/ regions, from Jan. to Dec. 2013, the largest increase of volume and value were both in Bangladesh, increased 406% in volume and 378.9% in value year on year.
China Manganese Ores and Concentrates Original Places of Exported Goods, from Jan. to Dec. 2013
| No. | Regions | Volume (Kg) | Value (USD) | Year-on-Year | ||
| Volume | Value | |||||
| 1 | Guangdong | 45,078,498 | 8,835,225 | -49.6% | -46.4% | |
| 2 | Ningxia Hui Autonomous Region | 1,053,000 | 204,455 | -55.7% | -55.9% | |
| 3 | Yunnan | 3,261,000 | 115,656 | 0 | 0 | |
| 4 | Liaoning | 185,500 | 71,890 | 209.2% | 565.6% | |
| 5 | Henan | 342,000 | 68,679 | -68.6% | -66.8% | |
| 6 | Hunan | 197,000 | 67,618 | 19.4% | -16.6% | |
| 7 | Guangxi Zhuang Autonomous Region | 258,776 | 59,426 | -60.2% | -60.7% | |
| 8 | Hebei | 61,000 | 38,530 | -14.1% | -7.6% | |
| 9 | Guizhou | 60,000 | 12,000 | 50% | 66.7% | |
| 10 | Heilongjiang | 21,000 | 9,870 | 133.3% | 133.3% | |
The major manganese ores and concentrates original places in China are Guangdong. From Jan. to Dec. 2013, the export volume of Guangdong accounted for 89.14% of the total export volume, and the export value of Guangdong accounted for 92.97% of the total export value.


