China Iron Ores and Concentrates Export Volume and Value, from Jan. to Dec. 2013
| Month | Volume (Kg) | Value (USD) | Year-on-Year | |
| Volume | Value | |||
| Jan. | 570,435 | 120,496 | 78% | 432.1% |
| Feb. | 577,590 | 147,885 | 7.9% | -21% |
| Mar. | 380,425 | 87,910 | -61.8% | -70.2% |
| Apr. | 1,231,950 | 328,704 | 80.1% | 61.3% |
| May | 1,032,830 | 237,702 | -0.5% | -35.5% |
| Jun. | 691,915 | 189,571 | -7.6% | -29.4% |
| Jul. | 841,146 | 161,008 | 283114% | 119165% |
| Aug. | 30,178 | 6,021 | 1707.1% | 1842.3% |
| Sept. | 236,500 | 89,846 | 68.8% | 75.3% |
| Oct. | 303,675 | 69,224 | -98.9% | -98.8% |
| Nov. | 53,246,203 | 7,673,916 | 64341% | 26232% |
| Dec. | 337,000 | 83,925 | -52.3% | -85.3% |
| Total | 59,479,847 | 9,196,208 | 81.6% | 16.8% |
The export volume of Chinese iron ores and concentrates was 59.5 thousand tons, from Jan. to Dec. 2013, increased 81.6% year on year; the export value was 9.1962 million dollars, increased 16.8% year on year.
China Iron Ores and Concentrates Major Export Countries/Regions Distribution, from Jan. to Dec. 2013
| No. | Countries/ Regions | Volume (Kg) | Value (USD) | Year-on-Year | |
| Volume | Value | ||||
| 1 | Republic of Korea | 53,480,710 | 7,773,033 | 93.4% | 30.5% |
| 2 | India | 5,486,230 | 1,284,950 | 2784.5% | 2457.4% |
| 3 | Mongolia | 288,716 | 61,683 | -92.2% | -95.1% |
| 4 | Taiwan | 24,595 | 24,020 | 20.3% | 718.7% |
| 5 | Venezuela | 17,000 | 13,596 | 0 | 0 |
| 6 | Ethiopia | 2,500 | 10,575 | 0 | 0 |
| 7 | Sri Lanka | 80,000 | 10,388 | 0 | 0 |
| 8 | Malaysia | 29,780 | 5,956 | 0 | 0 |
| 9 | Australia | 45,323 | 4,540 | 115.2% | 44.7% |
| 10 | Philippines | 11,500 | 4,246 | 0 | 0 |
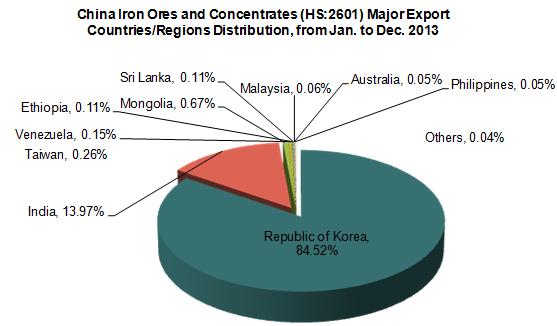
The largest export market for Chinese iron ores and concentrates is Korea. The total export value to Korea was 7.773 million dollars, from Jan. to Dec. 2013, increased 30.5% year on year. Among the total export value of iron ores and concentrates, it accounted for 84.52%, followed by India, which accounted for 13.97%.
Among the top ten export countries/ regions, from Jan. to Dec. 2013, the largest increase of volume and value were both in India, increased 2784.5% in volume and 2457.4% in value.
China Iron Ores and Concentrates Original Places of Exported Goods, from Jan. to Dec. 2013
| No. | Regions | Volume (Kg) | Value (USD) | Year-on-Year | ||
| Volume | Value | |||||
| 1 | Shandong | 53,249,820 | 7,675,149 | 479628% | 531788% | |
| 2 | Hebei | 2,279,283 | 518,529 | 86.5% | 88.1% | |
| 3 | Hubei | 1,711,500 | 479,066 | -93.8% | -91.8% | |
| 4 | Henan | 760,000 | 162,000 | 262% | 372.7% | |
| 5 | Qinghai | 750,000 | 140,500 | 400% | 242.7% | |
| 6 | Liaoning | 251,210 | 98,270 | 55.5% | 18.9% | |
| 7 | Inner Mongolia Autonomous Region | 290,868 | 61,927 | -89.6% | -93.8% | |
| 8 | Zhejiang | 49,780 | 27,451 | 3333.1% | 1368.8% | |
| 9 | Tianjin | 17,095 | 13,696 | -97.2% | -97.5% | |
| 10 | Beijing | 106,000 | 13,232 | 403.3% | 364.4% | |
The major iron ores and concentrates original places in China are Shandong. From Jan. to Dec. 2013, the export volume of Shandong accounted for 89.53% of the total export volume, and the export value of Shandong accounted for 83.46% of the total export value.


