From Jan. - Dec. 2014, China bags, cases & boxes export volume added up to 3001.5 thousand tons; Export value added up to 27.125 billion dollars. Export volume dropped by 0.6%, compared to the same period of last year; while export value dropped by 1.7%.
China Bags, Cases & Boxes Export Volume and Value, from Jan. to Dec. 2014
| Month | Volume(Kg) | Value (USD) | Compared to the Same Period of Last Year | |
| Volume | Value | |||
| Jan. | 297,549,642 | 2,874,094,623 | 11% | 10% |
| Feb. | 110,217,846 | 1,058,461,505 | -40.9% | -41.2% |
| Mar. | 185,406,684 | 1,528,947,793 | 13.1% | -0.3% |
| Apr. | 279,885,326 | 2,229,285,546 | 8.8% | -0.8% |
| May | 300,256,818 | 2,408,831,138 | 1.7% | -5.3% |
| Jun. | 279,912,835 | 2,381,574,727 | -2.6% | -4.1% |
| Jul. | 281,800,219 | 2,584,430,033 | 0.1% | 5.8% |
| Aug. | 261,993,519 | 2,493,917,520 | 0.9% | 8.5% |
| Sep. | 251,146,137 | 2,468,710,669 | -1.7% | 9.4% |
| Oct. | 254,022,862 | 2,294,259,949 | -0.9% | -3.5% |
| Nov. | 247,816,366 | 2,262,189,017 | -2.1% | -6.6% |
| Dec. | 251,537,224 | 2,540,099,534 | -1.8% | -1.3% |
| In total Jan.-Dec. | 3,001,545,478 | 27,124,802,054 | -0.6% | -1.7% |
China Bags, Cases & Boxes Major Countries/Regions Distribution, from Jan. to Dec. 2014
| No. | Countries | Volume(Kg) | Value(USD) | Compared to the Same Period of Last Year | |
| Volume | Value | ||||
| 1 | United States | 620,434,131 | 5,865,938,289 | -2.3% | -6.1% |
| 2 | Hong Kong | 152,624,667 | 1,897,770,136 | -12% | -19.3% |
| 3 | Japan | 143,918,545 | 1,737,666,882 | -2.9% | -1.6% |
| 4 | United Kingdom | 127,749,684 | 1,082,849,993 | 5.5% | -2.7% |
| 5 | Germany | 116,760,522 | 1,028,641,665 | 1.6% | -3.4% |
| 6 | Italy | 81,852,220 | 775,431,433 | 4% | 7% |
| 7 | Korea | 67,859,926 | 775,353,857 | 0.2% | 29.1% |
| 8 | France | 81,056,854 | 714,223,940 | 3.6% | -3.2% |
| 9 | United Arab Emirates | 90,157,188 | 706,923,705 | 23.1% | 31.9% |
| 10 | Brazil | 102,443,189 | 702,496,834 | 0 | 6.5% |
| 11 | Netherlands | 67,971,661 | 687,840,125 | 2.9% | -1.4% |
| 12 | Russia | 53,139,739 | 664,806,390 | -0.8% | -8.8% |
| 13 | Spain | 75,053,782 | 642,207,026 | 7.6% | 3.8% |
| 14 | Malaysia | 53,441,620 | 611,458,965 | -13.5% | -13.1% |
| 15 | Iran | 48,903,111 | 582,462,166 | 59.3% | 81.1% |
| 16 | Singapore | 49,839,101 | 575,774,080 | 34.2% | 23.9% |
| 17 | Canada | 57,783,275 | 463,595,846 | 0.3% | -5.9% |
| 18 | Belgium | 50,829,895 | 434,566,037 | -0.9% | 0.6% |
| 19 | Australia | 49,066,280 | 427,462,993 | -4% | -4.7% |
| 20 | India | 58,315,600 | 394,541,801 | -8.6% | -10.2% |

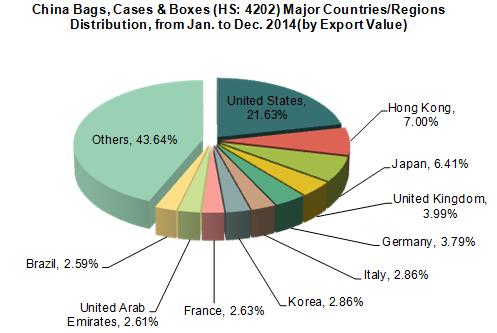
Basing on the export data from Jan. to Dec. 2014, major export markets of China bags, cases & boxes are the United States, Hong Kong, Japan, United Kingdom, Germany, Italy, Korea, France, United Arab Emirates and Brazil etc
The United States, Hong Kong and Japan are the first three biggest export markets. China export value to the three countries respectively accounts for 21.63%, 7.00% and 6.41% of total export value about the product.
From Jan. to Dec. 2014, among the first 20 biggest export markets, the export value to Iran increased by 81.1% at the fastest speed, compared to the same period of 2013.
China Bags, Cases & Boxes Original Places of Exported Goods, from Jan. to Dec. 2014
| No. | Regions | Volume(Set) | Value(USD) | Compared to the Same Period of Last Year | |
| Volume | Value | ||||
| 1 | Guangdong | 1,129,361,595 | 13,111,352,931 | -0.4% | -2.3% |
| 2 | Zhejiang | 922,222,124 | 4,922,389,379 | 2.6% | 10% |
| 3 | Fujian | 248,213,706 | 2,248,744,457 | -0.8% | -2.9% |
| 4 | Shanghai | 169,459,098 | 1,421,480,383 | -3.3% | 5.8% |
| 5 | Jiangsu | 151,888,127 | 1,335,175,774 | -7.6% | -6.2% |
| 6 | Shandong | 72,271,933 | 1,061,382,790 | -2.5% | 0 |
| 7 | Xinjiang | 44,129,570 | 495,807,362 | -10.7% | 1% |
| 8 | Jiangxi | 38,624,841 | 453,101,682 | -12% | -17.9% |
| 9 | Hebei | 76,737,727 | 448,892,247 | 29% | 27.2% |
| 10 | Heilongjiang | 18,588,789 | 280,315,976 | -11% | -38.1% |
| 11 | Anhui | 37,082,303 | 277,666,405 | -23% | -34.1% |
| 12 | Hunan | 23,149,875 | 231,928,674 | 54.1% | 56.8% |
| 13 | Sichuan | 8,030,205 | 112,423,546 | -17.9% | -22.5% |
| 14 | Henan | 9,108,429 | 93,873,656 | 59% | 33.1% |
| 15 | Tianjin | 10,757,769 | 81,500,631 | 27.9% | 9% |
| 16 | Tibet | 3,502,776 | 80,848,548 | -1.8% | 34.1% |
| 17 | Hubei | 9,676,609 | 69,012,541 | -2.9% | -1.5% |
| 18 | Chongqing | 4,431,320 | 63,268,295 | -68.7% | -73% |
| 19 | Shaanxi | 4,332,246 | 57,507,024 | -8.1% | -18.5% |
| 20 | Liaoning | 3,686,128 | 53,516,272 | -71.5% | -68.3% |
Guangdong, Zhejiang and Fujian are major original places of exported goods. From Jan. to Dec. 2014, the total export volume of above three provinces accounts for 76.62% of total export volume. Export value accounts for 74.77% of all, Guangdong export volume accounting for 37.63%, export value accounting for 48.34%.
Source: China Customs


