Flash Memory(HS:852351)Global Demand Analysis
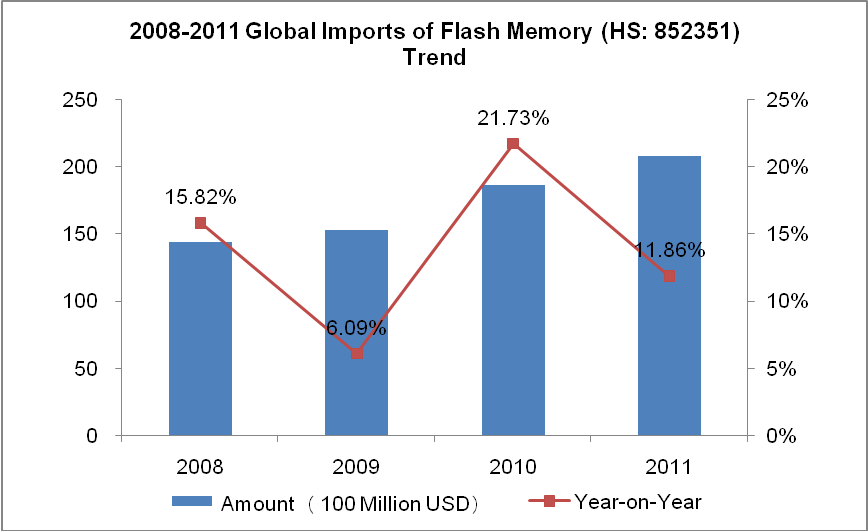
2008-2011 Trend of Global Demand on Flash Memory

Jan. – Sep. 2012 Flash Memory(HS:852351)Major Importing Countries &Regions
| No. | Importing Countries
| Imports (Thousand USD) | Compared with last year (the same period) |
| 1 | USA | 1,835,244 | 32.28% |
| 2 | China | 1,646,635 | -17.54% |
| 3 | Japan | 1,018,866 | 9.21% |
| 4 | Chinese Taipei | 974,232 | -34.17% |
| 5 | Germany | 644,071 | 6.74% |
| 6 | South Korea | 461,098 | -56.49% |
| 7 | United Kingdom | 456,768 | -1.50% |
| 8 | Netherlands | 447,652 | -16.57% |
| 9 | Russian Federation | 249,429 | 19.83% |
| 10 | Singapore | 233,296 | 91.89% |
| 11 | Poland | 225,935 | 34.11% |
| 12 | France | 212,069 | 29.83% |
| 13 | Mexico | 182,009 | -38.49% |
| 14 | Brazil | 165,616 | -14.70% |
| 15 | Australia | 162,143 | 53.16% |
| 16 | Canada | 145,445 | -11.94% |
| 17 | Czech | 132,000 | 9.10% |
| 18 | India | 114,392 | -14.18% |
| 19 | Italy | 111,557 | -2.88% |
| 20 | Paraguay | 84,411 | 2.49% |
From 2008 to 2011, the global imports of flash memory appear an upward trend. In 2011, the global imports of flash memory amounted to $ 20.78 billion, with a year-on-year growth of 11.86%.
In the first three quarters of 2012, the major importing countries of flash memory are the United States, China, Japan, Chinese Taipei, Germany, South Korea, the United Kingdom, the Netherlands, the Russian Federation and Singapore and so on. The United States is the biggest importing country, which amounted to $ 1.835 billion from January to September in 2012, with an increase of 32.28%. In addition, Singapore obviously increases in demand of flash memory.
Flash Memory Industry(HS:852351)Major Importing Market Analysis
U.S. Demand for Flash Memory
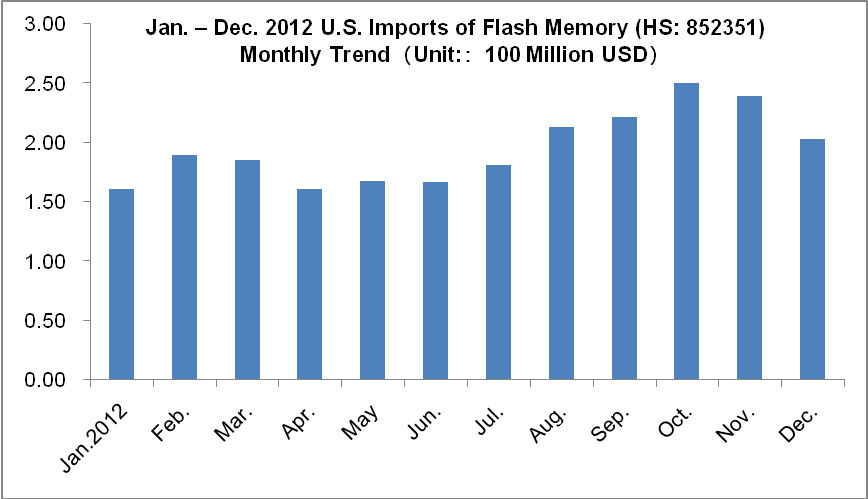
Jan. – Dec. 2012 U.S. Imports of Flash Memory Monthly Trend

Jan.-Dec. 2012 U.S. Flash Memory Importing(HS:852351)Major Supply Countries/Regions (Sorted by Import Amount)
| No. | Countries/Regions | Export Value(Thousand USD) | Year-on-Year |
| 1 | China | 1,176,339 | 50.29% |
| 2 | Chinese Taipei | 519,621 | 22.21% |
| 3 | South Korea | 327,488 | 14.00% |
| 4 | Malaysia | 149,921 | 6.41% |
| 5 | Japan | 55,516 | 2.37% |
| 6 | Singapore | 25,730 | 1.10% |
| 7 | Philippines | 22,209 | 0.95% |
| 8 | Thailand | 15,983 | 0.68% |
| 9 | Germany | 14,769 | 0.63% |
| 10 | Canada | 5,861 | 0.25% |
According to the monthly trend of flash memory of import amount from January to December in 2012, the United States takes relatively small import amount in the second quarter.From January to December in 2012, USA mainly imported from China, Chinese Taipei, South Korea, Malaysia, Japan, Singapore, the Philippines, Thailand, Germany and Canada. Among them, China is the first supply country for the United States imports, with the market share of 50.29%.
Japan Demand for Flash Memory
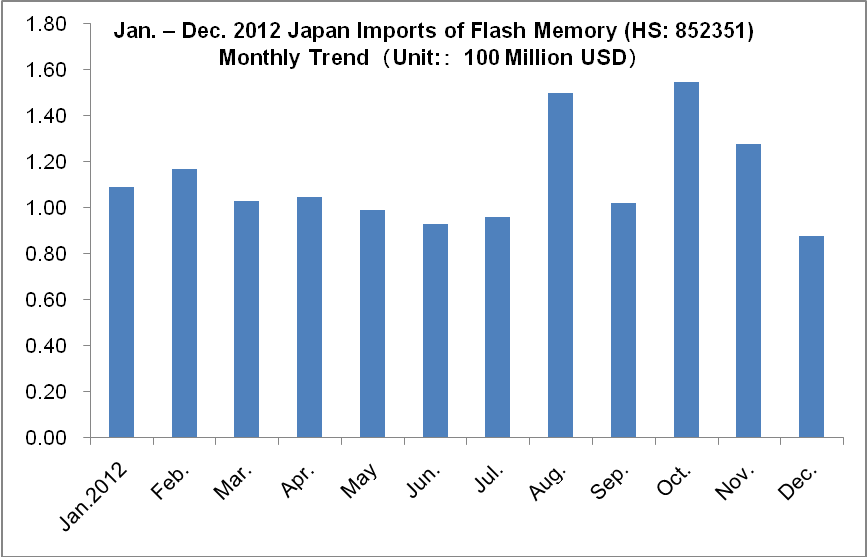
Jan. – Dec. 2012 Japan Imports of Flash Memory Monthly Trend

Jan.-Dec. 2012 Japan Flash Memory Importing(HS:852351)Major Supply Countries (Sorted by Import Amount)
| No. | Countries/Regions | Export Value (Thousand USD) | Year-on-Year |
| 1 | Chinese Taipei | 721,943 | 53.62% |
| 2 | China | 393,166 | 29.20% |
| 3 | South Korea | 92,942 | 6.90% |
| 4 | the Philippines | 53,752 | 3.99% |
| 5 | USA | 32,160 | 2.39% |
| 6 | Singapore | 14,836 | 1.10% |
| 7 | Malaysia | 9,439 | 0.70% |
| 8 | Germany | 8,729 | 0.65% |
| 9 | Hong Kong | 6,054 | 0.45% |
| 10 | Thailand | 1,942 | 0.14% |
According to the monthly trend of flash memory of import amount from January to December 2012 in Japan, the imports in the second half year are slightly higher than in the first half year. .From January to December in 2012, Japan mainly imported from Chinese Taipei, China, South Korea, the Philippines, USA, Singapore, Malaysia, Germany, Hong Kong and Thailand. Among them, Chinese Taipei is the first supply country for Japan imports, with the market share of 53.62%.
South Korea Demand for Flash Memory
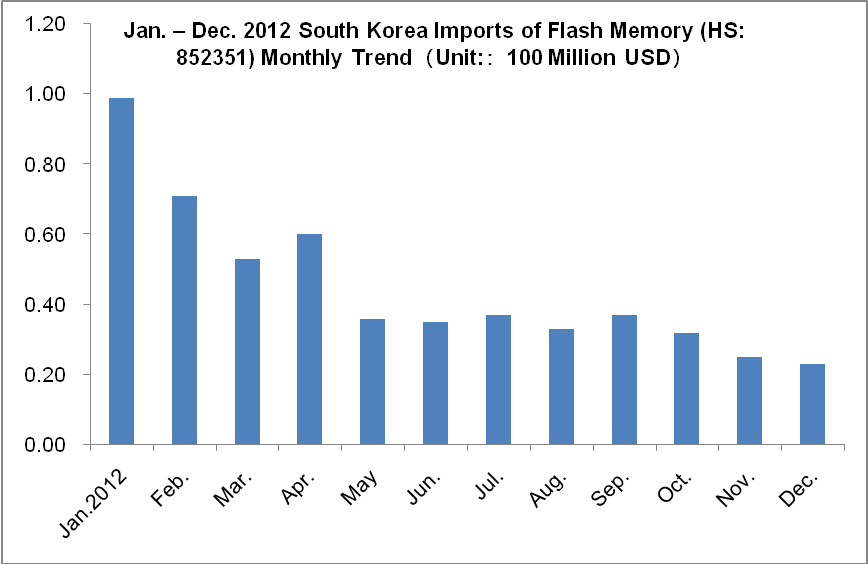
Jan. – Dec. 2012 South Korea Imports of Flash Memory Monthly Trend

Jan.-Dec. 2012 South Korea Flash Memory Importing(HS:852351)Major Supply Countries (Sort by Import Amount)
| No. | Countries/Regions | Export Value (Thousand USD) | Year-on-Year |
| 1 | Chinese Taipei | 392,731 | 72.43% |
| 2 | China | 97,335 | 17.95% |
| 3 | USA | 11,521 | 2.12% |
| 4 | Singapore | 9,016 | 1.66% |
| 5 | Philippine | 7,254 | 1.34% |
| 6 | Japan | 6,420 | 1.18% |
| 7 | Germany | 6,401 | 1.18% |
| 8 | Hong Kong | 5,517 | 1.02% |
| 9 | Netherlands | 1,300 | 0.24% |
| 10 | Sweden | 847 | 0.16% |
According to the monthly trend of flash memory of import amount from January to December 2012 in South Korea, the imports in the first half year are obvious higher than in the second half year
.From January to December in 2012, South Korea mainly imported from Chinese Taipei, China, USA, Singapore, Philippines, Japan, Germany, Hong Kong, Netherlands and Sweden. Among them, Chinese Taipei's market share reached 72.43%
(Source:UN COMTRADE)


