Export Quantity & Value for Chinese Chandeliers (HS: 940510) from Jan. to Nov. in 2012
| Month | Quantity (unit) | Value (USD) | Year on Year (±%) (Quantity) | Year on Year (±%) (Value) |
| Jan. | 38,895,404 | 225,317,746 | -16.7 | -2.1 |
| Feb. | 20,390,911 | 119,165,038 | -10.7 | 7.7 |
| Mar. | 33,940,330 | 217,617,266 | 14 | 25.7 |
| Apr. | 37,007,480 | 214,821,426 | -4.3 | 10.8 |
| May | 42,710,404 | 240,584,068 | 3.1 | 11 |
| Jun. | 41,438,404 | 242,441,755 | 3.8 | 13.9 |
| Jul. | 41,216,942 | 230,584,373 | -4.9 | 4.3 |
| Aug. | 41,342,845 | 255,423,327 | -0.7 | 14.1 |
| Sep. | 43,801,210 | 256,874,844 | 7.3 | 18.5 |
| Oct. | 40,204,272 | 268,100,131 | 10 | 35 |
| Nov. | 32,754,984 | 230,062,805 | -19.6 | 1.2 |
| Total | 413,703,186 | 2,500,992,779 | -2.1 | 12.4 |
Major Importers for Chinese Chandeliers (HS: 940510) from Jan. to Nov. in 2012 (Sorted by Value)
| No. | Countries/ Regions | From Jan. to Nov. in 2012 | Year on Year (±%) | ||
| Quantity (Unit) | Value (USD) | Quantity | Quantity | ||
| 1 | USA | 74,017,389 | 588,875,258 | 11 | 14.2 |
| 2 | Germany | 26,279,566 | 187,926,045 | -4.7 | -5.8 |
| 3 | Japan | 7,866,596 | 184,988,386 | 27 | 167.9 |
| 4 | United Kingdom | 16,930,483 | 113,653,597 | -4.4 | 9.1 |
| 5 | Netherlands | 12,705,584 | 110,414,327 | -9.7 | 4 |
| 6 | Russian Federation | 24,736,314 | 100,126,665 | 2.9 | 16.9 |
| 7 | France | 12,345,463 | 79,197,621 | 4.5 | -2.6 |
| 8 | Canada | 11,055,232 | 76,150,599 | 21 | 19.9 |
| 9 | Belgium | 9,249,454 | 63,055,558 | 3.6 | 10.6 |
| 10 | United Arab Emirates | 14,204,858 | 55,804,851 | 5.1 | -1.1 |
| 11 | Italy | 9,152,058 | 55,238,016 | -16 | -13.5 |
| 12 | Australia | 7,427,565 | 54,304,995 | 5.4 | 16.4 |
| 13 | Spain | 9,078,787 | 50,748,575 | -1.9 | 2 |
| 14 | Hong Kong | 5,924,287 | 41,092,544 | 3.6 | 0.1 |
| 15 | Malaysia | 8,060,134 | 38,743,164 | 2.6 | 117.6 |
| 16 | India | 9,345,519 | 37,724,088 | 7.7 | 23.8 |
| 17 | Sweden | 4,250,328 | 34,605,687 | 6.3 | 7.6 |
| 18 | Mexico | 7,179,575 | 33,881,504 | 24.5 | 41.8 |
| 19 | Poland | 9,083,001 | 33,753,139 | -3.1 | 4.3 |
| 20 | Norway | 2,686,881 | 28,913,183 | 29.9 | 56.9 |

Customs'Export Quantity&Value for Chinese Chandeliers (HS: 940510) from Jan. to Nov. in 2012 (Sorted by Value)
| No. | By Customs | From Jan. to Nov. in 2012 | Year on Year (±%) | ||
| Quantity (Unit) | Value (USD) | Quantity | Value | ||
| 1 | Shenzhen Customs | 140,356,933 | 900,616,600 | 3.2 | 13.1 |
| 2 | Gongbei Customs | 56,314,912 | 378,786,370 | -10 | -0.5 |
| 3 | Guangzhou Customs | 63,943,905 | 338,388,694 | -2.8 | 25.3 |
| 4 | Huangpu Customs | 57,091,060 | 261,167,582 | -12.9 | -5.6 |
| 5 | Shanghai Customs | 36,003,457 | 240,754,928 | 8.7 | 14.8 |
| 6 | Ningbo Customs | 38,552,049 | 175,854,965 | -0.6 | 9.2 |
| 7 | Dalian Customs | 1,093,279 | 71,805,732 | 734 | 984.8 |
| 8 | Jiangmen Customs | 10,563,796 | 49,776,371 | 8.7 | 12.4 |
| 9 | Nanjing Customs | 1,437,371 | 28,629,420 | -42.5 | -16.6 |
| 10 | Hangzhou Customs | 2,033,304 | 17,522,988 | -4.2 | 23.7 |
Major Cities/Provinces for Chinese Chandeliers Export (HS: 940510) from Jan. to Nov. in 2012 (Sorted by Value)
| No. | Cities/Provinces | From Jan. to Nov. in 2012 | Year on Year (±%) | ||
| Quantity (Unit) | Value (USD) | Quantity | Value | ||
| 1 | Guangdong | 327,899,326 | 1,912,721,861 | -3.6 | 7.9 |
| 2 | Zhejiang | 48,762,515 | 227,303,073 | 1.6 | 6.6 |
| 3 | Jiangsu | 16,839,540 | 117,359,222 | 9.9 | 11.3 |
| 4 | Shanghai | 12,184,056 | 113,559,081 | -5.4 | 15.4 |
| 5 | Liaoning | 1,047,369 | 71,156,456 | 850.1 | 1003.5 |
| 6 | Hunan | 365,638 | 20,393,480 | 1354114.8
| 605048 |
| 7 | Fujian | 3,672,890 | 19,598,433 | -1.1 | 24.3 |
| 8 | Shandong | 817,601 | 7,047,467 | 47.6 | 98.3 |
| 9 | Anhui | 336,636 | 2,947,115 | 3138.1 | 1620 |
| 10 | Beijing | 165,038 | 2,751,326 | -34.7 | -25.6 |
From Jan. to Nov. in 2012, the total export quantity for chandeliers achieved 0.414 billion sets, and the total export value was about 2.5 billion dollars, up 12.4% year on year.
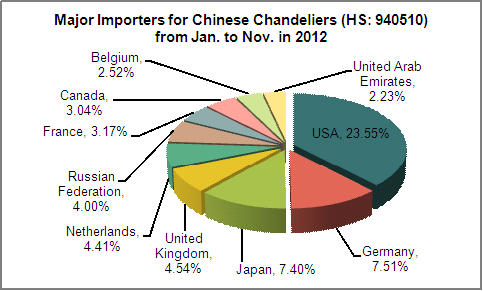
The major exporters were USA, Germany and Japan and so on. The export value for USA occupied 23.55% of the total export value.
The major exports Customs were Shenzhen, Gongbei and Guangzhou, which export values reached 1.62 billion dollars, occupied 64.69% of the total export value.
The major cities and provinces concentrated in Guangdong and Zhejiang.


