2013 China Hardware Tool Industry Export Situation
2013 Jan.-Dec. China Agriculture\ Horticulture \ Forestry Hand Tool(HS: 8201)Export Trend Analysis
2013 Jan.-Dec. China Agriculture\ Horticulture \ Forestry Hand Tool Export Volume and Value
| Month | Volume (Kg) | Value ($) | Year on Year | |
|
|
|
| Volume | Value |
| Jan. | 24,967,125 | 64,484,264 | -6.4% | -3.5% |
| Feb. | 18,444,404 | 45,641,966 | 52.4% | 51.6% |
| Mar. | 16,243,893 | 42,020,275 | -21.3% | -15.1% |
| Apr. | 21,374,010 | 50,557,131 | 0 | -1% |
| May | 21,871,569 | 47,502,441 | 6.2% | 4.1% |
| Jun. | 19,728,187 | 45,741,314 | -2.5% | -0.1% |
| Jul. | 22,051,098 | 49,386,974 | 24.5% | 15.7% |
| Aug. | 18,386,461 | 42,912,594 | -3.9% | -1.5% |
| Sep. | 17,151,320 | 40,284,395 | 3.2% | 8.8% |
| Oct. | 17,729,283 | 41,887,603 | 11.3% | 17.9% |
| Nov. | 17,851,857 | 45,666,897 | -4.1% | 8.2% |
| Dec. | 25,096,996 | 67,425,397 | 12% | 14% |
| Total | 240,896,203 | 583,511,251 | 3.8% | 6.3% |
China’s export value for agriculture\ horticulture\ forestry hand tools from Jan. to Dec. 2013 amounted to 584 million US dollars, an increase of 6.3% compared to the same period of last year.
2013 Jan.-Dec. China Agriculture\ Horticulture \ Forestry Hand Tool Mainly Export Country \ Region Distribution
| No. | Country | Volume (Kg) | Value ($) | Year on Year | |
|
|
|
|
| Volume | Value |
| 1 | USA | 27,551,990 | 102,224,456 | -9.7% | -0.2% |
| 2 | Japan | 7,882,201 | 28,525,903 | 0.4% | -6.5% |
| 3 | Germany | 6,509,080 | 23,527,594 | -1.8% | 1.3% |
| 4 | United Kingdom | 6,350,466 | 23,491,039 | 4.9% | 3% |
| 5 | Kenya | 14,847,808 | 21,426,558 | 15.3% | 16.2% |
| 6 | Russian Federation | 9,242,751 | 20,977,845 | 35.7% | 24% |
| 7 | Netherlands | 6,262,380 | 19,754,705 | 9.4% | 5% |
| 8 | Australia | 5,676,980 | 17,634,900 | 18.3% | 15% |
| 9 | Tanzania | 12,004,853 | 17,071,443 | -6.3% | -4.1% |
| 10 | Malaysia | 6,829,951 | 14,918,507 | 7.5% | 32.4% |
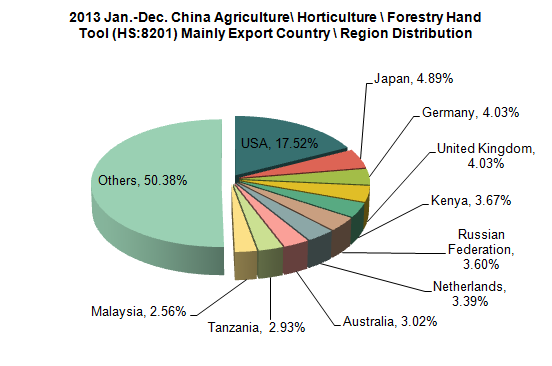
The biggest export market for China's agriculture\ horticulture\ forestry hand tools was USA from Jan. to Dec., 2013. The export value amounted to 102 million US dollars, a decrease of 0.2% year on year; which accounted for 17.52% of the total export value of this product, followed by Japan, which accounted for 4.89% market share.
Among the top ten export countries/ regions for China's agriculture\ horticulture\ forestry hand tools from Jan. to Dec., 2013, the largest increase of export volume was to Russian Federation (increased 35.7% year on year); while, the largest increase of export value was to Malaysia (increased 32.4% year on year).
2013 Jan.-Dec. China Hand Saw(HS: 8202)Export Trend Analysis
2013 Jan.-Dec. China Hand Saw Export Volume and Value
| Month | Volume (Kg) | Value ($) | Year on Year | |
|
|
|
| Volume | Value |
| Jan. | 11,782,704 | 75,915,777 | 11.2% | 8.4% |
| Feb. | 7,810,844 | 54,499,042 | 46.8% | 25.2% |
| Mar. | 8,242,568 | 67,115,828 | -21.8% | -14.6% |
| Apr. | 11,276,747 | 76,890,710 | -1.6% | -2.8% |
| May | 11,719,910 | 80,643,437 | -0.4% | 3.8% |
| Jun. | 12,567,694 | 77,884,442 | 4.6% | -4.7% |
| Jul. | 11,895,169 | 80,886,653 | 12.9% | 11% |
| Aug. | 12,229,659 | 80,368,885 | 18.1% | 7.1% |
| Sep. | 11,024,664 | 77,336,399 | 1.5% | -3.8% |
| Oct. | 11,224,290 | 73,140,365 | 23.8% | 15.5% |
| Nov. | 10,715,154 | 81,241,021 | 15.9% | 20.1% |
| Dec. | 12,791,102 | 97,272,893 | 8.1% | 19% |
| Total | 133,280,505 | 923,195,452 | 7.8% | 5.9% |
China’s export value for hand saws from Jan. to Dec. 2013 amounted to 923 million US dollars, an increase of 5.9% compared to the same period of last year.
2013 Jan.-Dec. China Hand Saw Mainly Export Country\ Region Distribution
| No. | Country | Volume (-) | Value ($) | Year on Year | |
|
|
|
|
| Volume | Value |
| 1 | USA | 16,076,831 | 150,239,749 | 6.6% | 2.6% |
| 2 | India | 13,342,390 | 71,236,001 | 14.5% | 34.9% |
| 3 | Japan | 5,431,869 | 59,571,769 | 7.8% | 8.6% |
| 4 | Germany | 5,553,186 | 55,511,304 | -6.5% | -6.2% |
| 5 | Brazil | 8,168,067 | 51,257,989 | 20.6% | 16.5% |
| 6 | Viet Nam | 3,095,354 | 43,807,796 | -15.6% | -28.6% |
| 7 | Russian Federation | 5,155,282 | 30,176,495 | 3.9% | 3.1% |
| 8 | Republic of Korea | 1,768,904 | 25,284,685 | -0.6% | -2% |
| 9 | United Kingdom | 2,826,830 | 22,270,076 | -5% | 1.1% |
| 10 | Netherlands | 2,184,834 | 21,450,349 | 25.4% | 23.6% |
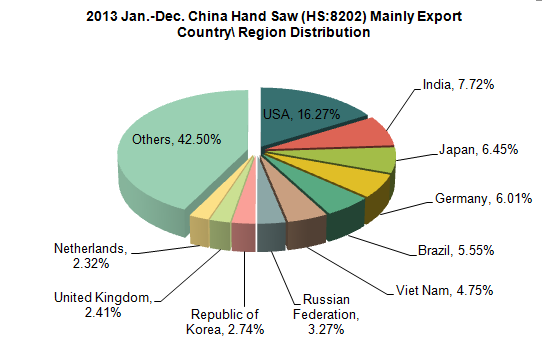
The biggest export market for China’s hand saws was USA from Jan. to Dec., 2013. The export value amounted to 150 million US dollars, an increase of 2.6% year on year; which accounted for 16.27% of the total export value of this product, followed by India, which accounted for 7.72% market share.
Among the top ten export countries/ regions for China's hand saws from Jan. to Dec., 2013, the largest increase of export volume was to Netherlands (increased 25.4% year on year); while, the largest increase of export value was to India (increased 34.9% year on year).
2013 Jan.-Dec. China Hand Wrench(HS: 8204)Export Trend Analysis
2013 Jan.-Dec. China Hand Wrench Export Volume and Value
| Month | Volume (Kg) | Value ($) | Year on Year | |
|
|
|
| Volume | Value |
| Jan. | 14,377,543 | 58,503,416 | 5.6% | 6.4% |
| Feb. | 9,785,350 | 42,794,201 | 72.1% | 79.4% |
| Mar. | 9,506,558 | 46,038,703 | -20.4% | -12.9% |
| Apr. | 13,375,041 | 58,161,593 | 2.3% | 4.5% |
| May. | 14,890,756 | 62,223,441 | -3.5% | -5.4% |
| Jun. | 14,232,669 | 60,573,625 | 7.3% | 5.5% |
| Jul. | 14,042,026 | 60,594,456 | 6.6% | 8% |
| Aug. | 14,636,938 | 67,661,739 | 7.3% | 10.7% |
| Sep. | 14,127,963 | 65,389,938 | -2.7% | -2% |
| Oct. | 12,277,832 | 54,365,064 | -2% | -1.8% |
| Nov. | 13,505,643 | 59,706,907 | 5.8% | 4% |
| Dec. | 14,255,719 | 65,783,883 | 1.9% | 11.9% |
| Total | 159,014,038 | 701,796,966 | 3.5% | 5.4% |
China’s export value for hand wrenches from Jan. to Dec. 2013 amounted to 702 million US dollars, an increase of 5.4% compared to the same period of last year.
2013 Jan.-Dec. China Hand Wrench Mainly Export Country\ Region Distribution
| No. | Country | Volume (-) | Value ($) | Year on Year | |
|
|
|
|
| Volume | Value |
| 1 | USA | 38,915,678 | 207,866,576 | 8.9% | 11.4% |
| 2 | Canada | 5,657,574 | 30,153,635 | 24.1% | 32.4% |
| 3 | Russian Federation | 7,267,726 | 27,319,543 | 17.2% | 23.1% |
| 4 | Indonesia | 7,168,832 | 24,798,935 | 4% | 9.5% |
| 5 | Viet Nam | 2,777,952 | 20,813,480 | -14.8% | -7.9% |
| 6 | Japan | 3,399,105 | 19,937,238 | -12.3% | -8.3% |
| 7 | France | 2,567,575 | 17,260,183 | -9.7% | -7.9% |
| 8 | United Arab Emirates | 4,544,088 | 17,046,653 | 3.4% | 7.8% |
| 9 | Taiwan | 4,445,981 | 16,839,275 | 32.5% | 0.2% |
| 10 | Germany | 3,732,354 | 16,758,633 | -7.1% | -9.7% |
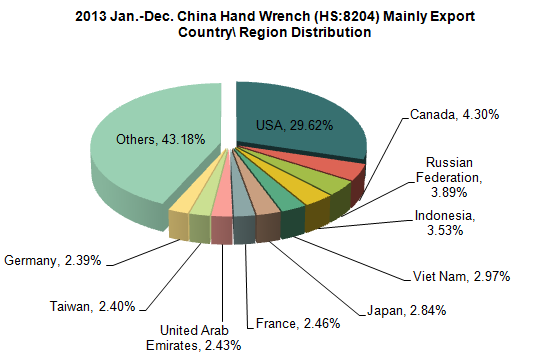
The biggest export market for China’s hand wrenches was USA from Jan. to Dec., 2013. The export value amounted to 208 million US dollars, an increase of 11.4% year on year; which accounted for 29.62% of the total export value of this product, followed by Canada, which accounted for 4.3% market share.
Among the top ten export countries/ regions for China's hand wrenches from Jan. to Dec., 2013, the largest increase of export volume was to Taiwan (increased 32.5% year on year); while, the largest increase of export value was to Canada (increased 32.4% year on year).
2013 Jan.-Dec. China Electric Tool(HS: 8467)Export Trend Analysis
2013 Jan.-Dec. China Electric Tool Export Volume and Value
| Month | Volume (Kg) | Value ($) | Year on Year | |
|
|
|
| Volume | Value |
| Jan. | 26,316,751 | 695,534,762 | -1% | 6.4% |
| Feb. | 19,067,322 | 525,038,043 | 36.6% | 26.7% |
| Mar. | 22,771,980 | 664,577,379 | -7.2% | 1.8% |
| Apr. | 26,074,877 | 716,059,139 | 3.8% | 10% |
| May | 25,413,553 | 662,725,602 | -2.4% | -0.4% |
| Jun. | 24,161,130 | 650,234,485 | -0.8% | 4.6% |
| Jul. | 26,311,134 | 707,301,335 | 7.7% | 10.1% |
| Aug. | 27,517,859 | 748,659,909 | 8.4% | 13.2% |
| Sep. | 26,118,008 | 725,854,900 | 2.2% | 6.8% |
| Oct. | 23,150,190 | 632,170,437 | 9.4% | 17.6% |
| Nov. | 23,801,195 | 636,462,033 | 14.5% | 21.4% |
| Dec. | 26,506,400 | 731,226,740 | 16% | 18.8% |
| Total | 297,210,399 | 8,095,844,764 | 5.8% | 10.6% |
China’s export value for electric tools from Jan. to Dec. 2013 amounted to 8.096 billion US dollars, an increase of 10.6% compared to the same period of last year.
2013 Jan.-Dec. China Electric Tool Mainly Export Country\ Region Distribution
| No. | Country | Volume (-) | Value ($) | Year on Year | |
|
|
|
|
| Volume | Value |
| 1 | USA | 74,066,052 | 2,276,268,085 | 4.6% | 9.3% |
| 2 | Germany | 16,037,219 | 508,369,913 | -6% | 0.7% |
| 3 | Russian Federation | 16,343,147 | 430,129,862 | 40.4% | 41.1% |
| 4 | Netherlands | 9,446,634 | 314,492,289 | 15% | 15.1% |
| 5 | Australia | 7,294,045 | 296,411,310 | 9.3% | 16.8% |
| 6 | United Kingdom | 9,327,555 | 286,929,965 | 3.1% | 7.7% |
| 7 | Belgium | 9,349,792 | 230,017,658 | 20.9% | 10.8% |
| 8 | Japan | 6,976,321 | 225,850,574 | 6.5% | 13.1% |
| 9 | Finland | 4,215,457 | 215,627,838 | 34.7% | 34.4% |
| 10 | Brazil | 10,084,604 | 202,725,653 | -5.4% | 13.2% |
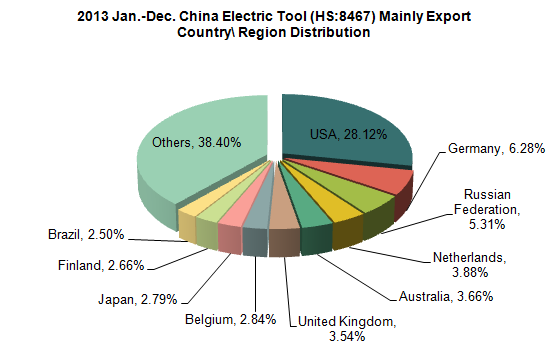
The biggest export market for China’s electric tools was USA from Jan. to Dec., 2013. The export value amounted to 2.276 billion US dollars, an increase of 9.3% year on year; which accounted for 28.12% of the total export value of this product, followed by Germany, which accounted for 6.28% market share.
Among the top ten export countries/ regions for China's electric tools from Jan. to Dec., 2013, the largest increase of export volume and value were both to Russian Federation, increased 40.4% and 41.1% respectively.
(Source: China Customs)


