Global Mattress Supports Industry Import and Export Situation and Analysis
2010-2012 Global Mattress Supports; Articles of Bedding and Similar Furnishing (HS: 9404) Annual Total Imports Trend
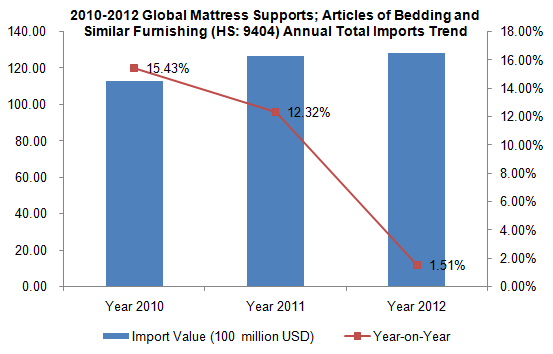
Global Mattress Supports; Articles of Bedding and Similar Furnishing Total Imports increased year by year from 2010 to 2012, of which, in 2012 import value totaled approximately $ 12,808,000,000, with an increase of 1.51%.
2010-2012 Global Mattress Supports; Articles of Bedding and Similar Furnishing (HS: 9404) Main Demand Countries/Regions Total Imports
| NO. | Import Country/Region | Import Value (Thousand USD) | Import Value Increase 2012 Compared with 2010 | ||
|
|
| 2010 | 2011 | 2012 |
|
| 1 | USA | 2,574,175 | 2,607,620 | 2,714,241 | 5.44% |
| 2 | Japan | 1,037,953 | 1,324,522 | 1,425,127 | 37.30% |
| 3 | Germany | 935,901 | 1,054,297 | 970,472 | 3.69% |
| 4 | France | 608,504 | 672,538 | 631,711 | 3.81% |
| 5 | UK | 498,994 | 512,575 | 512,201 | 2.65% |
| 6 | Canada | 430,767 | 452,947 | 487,258 | 13.11% |
| 7 | Netherlands | 385,809 | 442,468 | 380,901 | -1.27% |
| 8 | Australia | 233,975 | 282,876 | 320,315 | 36.90% |
| 9 | Sweden | 258,416 | 301,197 | 288,596 | 11.68% |
| 10 | Switzerland | 238,385 | 278,483 | 277,609 | 16.45% |
| 11 | Belgium | 262,923 | 295,402 | 270,719 | 2.97% |
| 12 | Spain | 317,038 | 329,259 | 268,421 | -15.33% |
| 13 | South Korea | 172,351 | 209,238 | 238,960 | 38.65% |
| 14 | Austria | 220,325 | 246,058 | 236,873 | 7.51% |
| 15 | Italy | 260,648 | 291,083 | 232,960 | -10.62% |
| 16 | Denmark | 172,498 | 197,825 | 192,346 | 11.51% |
| 17 | UAE | 173,134 | 191,753 | 186,561 | 7.76% |
| 18 | Norway | 159,699 | 186,899 | 179,819 | 12.60% |
| 19 | Mexico | 120,230 | 150,058 | 157,783 | 31.23% |
| 20 | Saudi Arabia | 80,952 | 109,831 | 150,707 | 86.17% |
The United States is the world's largest Mattress Supports; Articles of Bedding and Similar Furnishing importer, and the import value in 2012 amounted to approximately $ 2.714 billion, with an increase of 5.44% compared to 2010. Japan and Germany were respectively ranked second and third, and in 2012 import value grew by 37.30% and 3.69% separately. From 2010 to 2012, among the world's top twenty Mattress Supports; Articles of Bedding and Similar Furnishing importing countries / regions, there was the largest increase of import value in India compared 2012 to 2010, with an increase of 86.17%.
2010-2012 Global Mattress Supports; Articles of Bedding and Similar Furnishing (HS: 9404) Main Demand Countries/Regions Market Share
| NO. | Import Country/Region | Import Value in Proportion | ||
| 2010 | 2011 | 2012 | ||
| 1 | USA | 22.91% | 20.67% | 21.19% |
| 2 | Japan↑ | 9.24% | 10.50% | 11.13% |
| 3 | Germany | 8.33% | 8.36% | 7.58% |
| 4 | France | 5.42% | 5.33% | 4.93% |
| 5 | UK↓ | 4.44% | 4.06% | 4.00% |
| 6 | Canada | 3.83% | 3.59% | 3.80% |
| 7 | Netherlands | 3.43% | 3.51% | 2.97% |
| 8 | Australia↑ | 2.08% | 2.24% | 2.50% |
| 9 | Sweden | 2.30% | 2.39% | 2.25% |
| 10 | Switzerland | 2.12% | 2.21% | 2.17% |
| 11 | Belgium | 2.34% | 2.34% | 2.11% |
| 12 | Spain↓ | 2.82% | 2.61% | 2.10% |
| 13 | South Korea | 1.53% | 1.66% | 1.87% |
| 14 | Austria↓ | 1.96% | 1.95% | 1.85% |
| 15 | Italy↓ | 2.32% | 2.31% | 1.82% |
| 16 | Denmark | 1.54% | 1.57% | 1.50% |
| 17 | UAE↓ | 1.54% | 1.52% | 1.46% |
| 18 | Norway | 1.42% | 1.48% | 1.40% |
| 19 | Mexico↑ | 1.07% | 1.19% | 1.23% |
| 20 | Saudi Arabia↑ | 0.72% | 0.87% | 1.18% |
Note:↑represents import value accounted for the proportion of world's total import value continued to increase from 2010 to 2012,↓represents import value accounted for the proportion of world's total import value continued to decrease from 2010 to 2012.
From the three years of market share, countries of which import value in proportion continued to increase are Japan, Australia, Mexico and Saudi Arabia, countries of which import value in proportion continued to decrease are United Kingdom, Spain, Austria, Italy and the United Arab Emirates.
2010-2012 Global Mattress Supports; Articles of Bedding and Similar Furnishing (HS: 9404) Main Export Countries/Regions Total Exports
| NO. | Export Country/Region | Export Value (Thousand USD) | Export Value Increase 2012 Compared with 2010 | ||
|
|
| 2010 | 2011 | 2012 |
|
| 1 | China | 5,939,623 | 6,837,199 | 7,373,105 | 24.13% |
| 2 | Poland | 824,496 | 937,098 | 895,853 | 8.65% |
| 3 | Germany | 538,053 | 663,241 | 576,920 | 7.22% |
| 4 | Belgium | 419,123 | 436,694 | 399,866 | -4.59% |
| 5 | Denmark | 313,469 | 360,782 | 398,496 | 27.12% |
| 6 | USA | 315,766 | 343,583 | 367,245 | 16.30% |
| 7 | Italy | 322,266 | 350,298 | 326,138 | 1.20% |
| 8 | India | 226,003 | 265,225 | 278,398 | 23.18% |
| 9 | Mexico | 251,375 | 265,607 | 272,961 | 8.59% |
| 10 | Netherlands | 202,542 | 245,936 | 232,996 | 15.04% |
| 11 | Estonia | 168,837 | 211,714 | 197,640 | 17.06% |
| 12 | Austria | 197,737 | 211,922 | 180,771 | -8.58% |
| 13 | Sweden | 155,240 | 175,998 | 173,325 | 11.65% |
| 14 | France | 170,741 | 159,194 | 158,662 | -7.07% |
| 15 | Spain | 107,136 | 115,123 | 127,982 | 19.46% |
| 16 | UK | 118,629 | 119,737 | 116,143 | -2.10% |
| 17 | Lithuania | 51,475 | 88,710 | 108,144 | 110.09% |
| 18 | Turkey | 101,165 | 105,109 | 106,999 | 5.77% |
| 19 | Portugal | 72,251 | 100,421 | 106,470 | 47.36% |
| 20 | Norway | 69,443 | 84,039 | 95,965 | 38.19% |
China is the world's largest Mattress Supports; Articles of Bedding and Similar Furnishing exporter. In 2012 China Mattress Supports; Articles of Bedding and Similar Furnishing total export value accounted for 19.76% of the world's total export value of the products. From 2010 to 2012, among the world's top twenty Mattress Supports; Articles of Bedding and Similar Furnishing export supply countries, there was the largest increase of export value in Vietnam compared 2012 to 2010, with an increase of 66.73%.
2010-2012 Global Mattress Supports; Articles of Bedding and Similar Furnishing (HS: 9404) Main Export Countries/Regions Market Share
| NO. | Export Country/Region | Export Value in Proportion | ||
|
|
| 2010 | 2011 | 2012 |
| 1 | China↑ | 49.67% | 50.03% | 53.19% |
| 2 | Poland↓ | 6.90% | 6.86% | 6.46% |
| 3 | Germany | 4.50% | 4.85% | 4.16% |
| 4 | Belgium↓ | 3.51% | 3.20% | 2.88% |
| 5 | Denmark↑ | 2.62% | 2.64% | 2.87% |
| 6 | USA | 2.64% | 2.51% | 2.65% |
| 7 | Italy↓ | 2.70% | 2.56% | 2.35% |
| 8 | India↑ | 1.89% | 1.94% | 2.01% |
| 9 | Mexico | 2.10% | 1.94% | 1.97% |
| 10 | Netherlands | 1.69% | 1.80% | 1.68% |
| 11 | Estonia | 1.41% | 1.55% | 1.43% |
| 12 | Austria↓ | 1.65% | 1.55% | 1.30% |
| 13 | Sweden↓ | 1.30% | 1.29% | 1.25% |
| 14 | France↓ | 1.43% | 1.16% | 1.14% |
| 15 | Spain | 0.90% | 0.84% | 0.92% |
| 16 | UK↓ | 0.99% | 0.88% | 0.84% |
| 17 | Lithuania↑ | 0.43% | 0.65% | 0.78% |
| 18 | Turkey | 0.85% | 0.77% | 0.77% |
| 19 | Portugal↑ | 0.60% | 0.73% | 0.77% |
| 20 | Norway↑ | 0.58% | 0.61% | 0.69% |
Note:↑represents export value accounted for the proportion of world's total export value continued to increase from 2010 to 2012,↓represents export value accounted for the proportion of world's total export value continued to decrease from 2010 to 2012.
From the three years of market share, countries of which export value in proportion continued to increase are China, Denmark, India, Lithuania, Portugal and Norway, countries of which continued to decrease are Poland, Belgium, Italy, Austria, Sweden, France and the UK.
(Source: UN COMTRADE)


